
Homework Answers
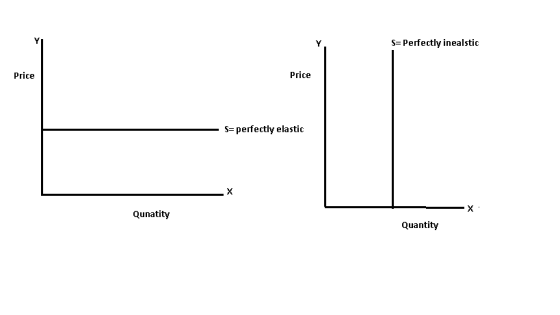
A perfectly elastic supply would be a horizontal line parallel to the X axis, in the perfectly elastic supply situation any decrease in the price of the product would decrease the quantity supplied to zero.
In the case of a perfectly inelastic supply , the supply curve will be a vertical straight line. The perfectly inelastic supply means the price does not have any effect on the quantity supplied.
Add Answer to:
Supply curves can have varying degrees of price elasticity. Show graphically a perfectly elastic, a perfectly...
25) What is measured by the price elasticity of supply? A) The price elasticity of supply...
25) What is measured by the price elasticity of supply? A) The price elasticity of supply measures how responsive producers are to changes in the price of other goods. B) The price elasticity of supply measures how responsive producers are to changes in income. C) The price elasticity of supply measures how responsive producers are to changes in the price of a product. D) The price elasticity of supply is a measure of the slope of the supply curve. E)...
Draw a graph with two demand curves – one that is fairly elastic (labeled De) and...
Draw a graph with two demand curves – one that is fairly elastic (labeled De) and one that is fairly inelastic (labeled Di). Draw a supply curve and label it S. Suppose this market sees an increase in the price of this good due to the imposition of a tax. Draw the new supply curve and label it S2. Compare the impact in the market of the shift in supply between the elastic demand curve and the inelastic demand curve....
Understand the price elasticity of demand formula 2. Draw a perfectly elastic and perfectly inelastic demand...
Understand the price elasticity of demand formula 2. Draw a perfectly elastic and perfectly inelastic demand curve and label each 3. Be able to identify whether demand is elastic or inelastic given changes in quantity and price 4. Be able to calculate percentage change using the midpoint formula and be able to apply it to calculate the price elasticity of demand 5. Know the determinants of the price elasticity of demand and be able to identify how they change price...
The graph to the right depicts the average cost curves and the marginal cost curve for...
 The graph to the right depicts the average cost curves and the marginal cost curve for a typical firm in a competitive industry. 1.) Using the line drawing fool, draw the firm's demand curve at a market price such that the firm is breaking even. Label your curved, 2.) Using the line drawing tool, draw the firm's demand curve at a market price such that the firm is at its shutdown price. Label your curved, Carefully follow the instructions above,...
Suppose Jim's and Sam's individual demand curves are shown in the figure to the right. Use...
 Suppose Jim's and Sam's individual demand curves are shown in the figure to the right. Use the multipoint curved line drawing tool to draw the total demand curve. Label this line 'D Total Carefully follow the instructions above, and only draw the required object Price 04 6 Dsam Djim 510 12 14 16 18 20 Quantity
The supply curves for Firm A and Firm B are shown in the figure to the...
 The supply curves for Firm A and Firm B are shown in the figure to the right. Suppose a quota on how much can be supplied by Firm A is imposed, Emiting it to producing quantity of no more thar SB 6,000 units. 1.) Use the multipoint curve drawing tool to completely redraw Firm A's supply curve, showing the effect of the quota. Label it 'S 2.) Use the multipoint curve drawing tool to draw the total supply curve in...
4. Draw three different supply curves on a graph: a) Make S1 highly elastic b) Make...
 4. Draw three different supply curves on a graph: a) Make S1 highly elastic b) Make S2 highly inelastic c) Make S3 perfectly inelastic d) Which supply curve is the supply curve for Vincent van Gogh's masterpiece, "A Starry Night"? e) Which supply curve is for an ice cream manufacturer? f) Which supply Curve if for an airplane manufacturer?
Draw and label a graph depicting world trade in which the world price is perfectly elastic...
Draw and label a graph depicting world trade in which the world price is perfectly elastic and higher than the country price. Start with a graph depicting market equilibrium with the demand curve and supply curves having slopes of approximately 1 (negative 1 for demand). Modify the graph to demonstrate the world market price being lower than the country market price.
Suppose the price elasticity of supply for a good is 2.0. This means... The supply of this good is elastic. Inputs...
 Suppose the price elasticity of supply for a good is 2.0. This means... The supply of this good is elastic. Inputs used to produce this good are probably rare and/or expensive. The supply of this good is inelastic. Inputs used to produce this good are probably rare and/or expensive. The supply of this good is elastic, Inputs used to produce this good are probably cheap and/or plentiful. The supply of this good is inelastic. Inputs used to produce this good...
Suppose these are the market demand and supply curves for hooded sweatshirts: Supply: P = 10...
Suppose these are the market demand and supply curves for hooded sweatshirts: Supply: P = 10 + 2QS Demand: P = 50−3QD (a) Sketch these two curves (that is, draw them, but don’t worry about numerical accuracy). Calculate equilibrium price and quantity. Calculate equilibrium price and quantity. (b) Show on your graph the areas of consumer and producer surplus. Calculate consumer and producer surplus at the equilibrium from part a. (c) Calculate the price elasticity of demand when price changes...
 The graph to the right depicts the average cost curves and the marginal cost curve for a typical firm in a competitive industry. 1.) Using the line drawing fool, draw the firm's demand curve at a market price such that the firm is breaking even. Label your curved, 2.) Using the line drawing tool, draw the firm's demand curve at a market price such that the firm is at its shutdown price. Label your curved, Carefully follow the instructions above,...
 Suppose Jim's and Sam's individual demand curves are shown in the figure to the right. Use the multipoint curved line drawing tool to draw the total demand curve. Label this line 'D Total Carefully follow the instructions above, and only draw the required object Price 04 6 Dsam Djim 510 12 14 16 18 20 Quantity
 The supply curves for Firm A and Firm B are shown in the figure to the right. Suppose a quota on how much can be supplied by Firm A is imposed, Emiting it to producing quantity of no more thar SB 6,000 units. 1.) Use the multipoint curve drawing tool to completely redraw Firm A's supply curve, showing the effect of the quota. Label it 'S 2.) Use the multipoint curve drawing tool to draw the total supply curve in...
 4. Draw three different supply curves on a graph: a) Make S1 highly elastic b) Make S2 highly inelastic c) Make S3 perfectly inelastic d) Which supply curve is the supply curve for Vincent van Gogh's masterpiece, "A Starry Night"? e) Which supply curve is for an ice cream manufacturer? f) Which supply Curve if for an airplane manufacturer?
 Suppose the price elasticity of supply for a good is 2.0. This means... The supply of this good is elastic. Inputs used to produce this good are probably rare and/or expensive. The supply of this good is inelastic. Inputs used to produce this good are probably rare and/or expensive. The supply of this good is elastic, Inputs used to produce this good are probably cheap and/or plentiful. The supply of this good is inelastic. Inputs used to produce this good...
Most questions answered within 3 hours.
-
Assume that capital markets are competitive and that the
international Fisher hypothesis holds. The one-year interest...
asked 20 minutes ago -
Solid potassium phosphate is slowly added to 150 mL of a 0.0518
M calcium nitrate solution....
asked 34 minutes ago -
(CO 2) A field can be added to a report to
values for two or more...
asked 2 hours ago -
Identify 3 research scenarios that might provide a low,
medium, and high degree of variability in...
asked 2 hours ago -
how
does gravity affect the trajectory of projectile? what would be the
shape of the trajactory...
asked 3 hours ago -
Two small plastic spheres are given positive electrical charges.
When they are a distance of 15.4...
asked 3 hours ago -
An acidic solution containing gold ions is
electrolyzed, producing gaseous oxygen (from water) at the anode...
asked 4 hours ago -
Assume that the population of Mexico is 128
million and that the population increases 1.01
percentannually....
asked 4 hours ago -
Can someone please help me add appropriate descriptive
comments to each line of code in the...
asked 5 hours ago -
Romeo wishes to throw a bouquet of flowers to Juliet, who is on
a second-story balcony,...
asked 6 hours ago -
Why is QE a controversial monetary policy tool.
A. It may lead to excessive inflation.B. By...
asked 6 hours ago -
Principles of Programming midterm study guide help!
1.)
______ Which of the following would reference the...
asked 5 hours ago