

Homework Answers
If the senator sets a price control at the price of $6 that is called the price ceiling, a binding price ceiling is set below the equilibrium. The equilibrium is where the labour demanded and supply is equal, the price ceiling would result in shortage of labour this is because at a lower wage no will not be interested to work.
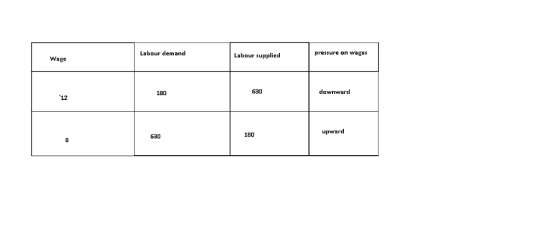
The wage $12 is above the equilibrium wage so there will excess labour supply and this will put downward pressure on the wages and reach the equilibrium. The wage $8 is below the equilibrium level so there will be excess demand for the labour and this will put upward pressure on the wages.
The minimum wage is a price floor and it is set above the equilibrium wage, so $10 minimum wage is not above the equilibrium and it is not binding.
FALSE.
Add Answer to:
4. Minimum wage legisiation The following graph shows the labor market in the fast-food industry in...
4. Minimum wage legislation The following graph shows the labor market in the fast-food industry in...
 4. Minimum wage legislation The following graph shows the labor market in the fast-food industry in the fictional town of Supersize City. tool to help you answer the following questions. You will not be graded on any changes you make to this graph. Note: Once you enter a value in a white field, the graph and any corresponding amounts in each grey field will change accordingly. Graph Input Tool Market for Labor in the Fast Food Industry 20 18 16...
4. Minimum wage legislation The following graph shows the labor market in the fast-food industry in...
 4. Minimum wage legislation The following graph shows the labor market in the fast-food industry in the fictional town of Supersize City. Use the graph input tool to help you answer the following questions. You will not be graded on any changes you make to this graph. Note: Once you enter a value in a white field, the graph and any corresponding amounts in each grey field will change accordingly. Graph Input Tool Market for Labor in the Fast Food...
The following graph shows the labor market in the fast-food industry in the fictional town of...
 The following graph shows the labor market in the fast-food industry in the fictional town of Supersize City. Use the graph input tool to help you answer the following questions. You will not be graded on any changes you make to this graph. Note: Once you enter a value in a white field, the graph and any corresponding amounts in each grey field will change accordingly. Graph Input Tool Market for Labor in the Fast Food Industry Wage (Dollars per...
4. Minimum wage legislation The following graph shows the labor market in the fast-food industry in...
 4. Minimum wage legislation The following graph shows the labor market in the fast-food industry in the fictional town of Supersize City Use the graph input tool to help you answer the fallowing questions. You will not be graded on any changes you make to this graph Note: Once you entera value in a white field, the graph and any corresponding amounts in each grey ficld w change accordingly. Graph Input Tool Market for Labor in the Fast Food Industry...
4. Minimum wage legislation The following graph shows the labor market in the fast-food industry in...
 4. Minimum wage legislation The following graph shows the labor market in the fast-food industry in the fictional town of Supersize City. Use the graph input tool to help you answer the following questions. You will not be graded on any changes you make to this graph. Note: Once you enter a value in a white field, the graph and any corresponding amounts in each grey field will change accordingly. In this market, the equilibrium hourly wage is and the equilibrium quantity of laboris...
The following graph shows the labor market in the fast food industry in the fictional town...
 The following graph shows the labor market in the fast food industry in the fictional town of Supersize City. Use the graph input tool to help you answer the following questions. You will not be graded on any changes you make to this graph. Note: Once you enter a value in a white field, the graph and any corresponding amounts in each grey field will change accordingly. Graph Input Tool Market for Labor in the Fast-Food Industry 6 Wage (Dollars...
The following graph shows the labor market in the fast-food Industry in the fictional town of...
 The following graph shows the labor market in the fast-food Industry in the fictional town of Supersize City. Use the graph input tool to help you answer the following questions. You will not be graded on any changes you make to this graph. Note: Once you enter a value in a white field, the graph and any corresponding amounts in each grey held will change accordingly. Graph Input Tool Market for Labor in the Fast Food Industry Wage (Dollars per...
The following graph shows the labor market in the fast-food industry in the fictional town of...
 The following graph shows the labor market in the fast-food industry in the fictional town of Supersize City Use the graph input tool to help you answer the following questions. You will not be graded on any changes you make to this graph Note: Once you enter a value in a white field, the graph and any corresponding amounts in each grey field will change accordingly. Graph Input Tool Market for Labor in the Fast Food Industry & Wage (Dollars...
The following graph shows the labor market in the fast-food industry in the fictional town of...
 The following graph shows the labor market in the fast-food industry in the fictional town of Supersize City. Use the graph input tool to help you answer the following questions. You will not be graded on any changes you make to this graph. Note: Once you enter a value in a white field, the graph and any corresponding amounts in each grey field will change accordingly. Graph Input Tool Market for Labor in the Fast Food Industry Supply Wage (Dollars...
 4. Minimum wage legislation The following graph shows the labor market in the fast-food industry in the fictional town of Supersize City. tool to help you answer the following questions. You will not be graded on any changes you make to this graph. Note: Once you enter a value in a white field, the graph and any corresponding amounts in each grey field will change accordingly. Graph Input Tool Market for Labor in the Fast Food Industry 20 18 16...
 4. Minimum wage legislation The following graph shows the labor market in the fast-food industry in the fictional town of Supersize City. Use the graph input tool to help you answer the following questions. You will not be graded on any changes you make to this graph. Note: Once you enter a value in a white field, the graph and any corresponding amounts in each grey field will change accordingly. Graph Input Tool Market for Labor in the Fast Food...
 4. Minimum wage legislation The following graph shows the labor market in the fast-food industry in the fictional town of Supersize City. Use the graph input tool to help you answer the following questions. You will not be graded on any changes you make to this graph. Note: Once you enter a value in a white field, the graph and any corresponding amounts in each grey field will change accordingly. Graph Input Tool Market for Labor in the Fast Food...
 The following graph shows the labor market in the fast-food industry in the fictional town of Supersize City. Use the graph input tool to help you answer the following questions. You will not be graded on any changes you make to this graph. Note: Once you enter a value in a white field, the graph and any corresponding amounts in each grey field will change accordingly. Graph Input Tool Market for Labor in the Fast Food Industry Wage (Dollars per...
 4. Minimum wage legislation The following graph shows the labor market in the fast-food industry in the fictional town of Supersize City Use the graph input tool to help you answer the fallowing questions. You will not be graded on any changes you make to this graph Note: Once you entera value in a white field, the graph and any corresponding amounts in each grey ficld w change accordingly. Graph Input Tool Market for Labor in the Fast Food Industry...
 The following graph shows the labor market in the fast food industry in the fictional town of Supersize City. Use the graph input tool to help you answer the following questions. You will not be graded on any changes you make to this graph. Note: Once you enter a value in a white field, the graph and any corresponding amounts in each grey field will change accordingly. Graph Input Tool Market for Labor in the Fast-Food Industry 6 Wage (Dollars...
 The following graph shows the labor market in the fast-food Industry in the fictional town of Supersize City. Use the graph input tool to help you answer the following questions. You will not be graded on any changes you make to this graph. Note: Once you enter a value in a white field, the graph and any corresponding amounts in each grey held will change accordingly. Graph Input Tool Market for Labor in the Fast Food Industry Wage (Dollars per...
 The following graph shows the labor market in the fast-food industry in the fictional town of Supersize City Use the graph input tool to help you answer the following questions. You will not be graded on any changes you make to this graph Note: Once you enter a value in a white field, the graph and any corresponding amounts in each grey field will change accordingly. Graph Input Tool Market for Labor in the Fast Food Industry & Wage (Dollars...
 The following graph shows the labor market in the fast-food industry in the fictional town of Supersize City. Use the graph input tool to help you answer the following questions. You will not be graded on any changes you make to this graph. Note: Once you enter a value in a white field, the graph and any corresponding amounts in each grey field will change accordingly. Graph Input Tool Market for Labor in the Fast Food Industry Supply Wage (Dollars...
Most questions answered within 3 hours.
-
Calculate the number density of argon gas at a temperature of
24C and a pressure of...
asked 2 hours ago -
Alternative
Classification
How to Estimate
Probabilities from Data? ( For continuous Attributes)
And How to generate...
asked 2 hours ago -
An explosion breaks a 20.0-kg object into three parts. The
object is initially moving at a...
asked 3 hours ago -
Calculate the approximate number of residues of Rubisco, which
is involved in carbon fixation in plants,...
asked 4 hours ago -
Other decisions about scientific claims can have a much broader
impact.ENERGYarrow-10x10.png, environment, health, security - all...
asked 4 hours ago -
I need to write a research paper and work cited about this
topic: The United States...
asked 5 hours ago -
Hello! I was wondering if I could have some help?
If the vapor pressure of carvone...
asked 5 hours ago -
An economist wants to estimate the mean per capita income (in
thousands of dollars) for a...
asked 6 hours ago -
What would be the input/output characteristic of a circuit
obtained by putting two of your 2's-complementers...
asked 5 hours ago -
In Drosophila, the transition from the syncytial blastoderm
stage to the cellular blastoderm stage is a...
asked 6 hours ago -
Project management question:
Name 3 different types of resources (hint: humans are one
type)
asked 6 hours ago -
Consider the following reaction: C 2H 2( g) + 2H 2( g) C 2H 6(
g)...
asked 6 hours ago