Total Blood Cholesterol Levels 160 160 170 150 160 170 155 350 180 155 180 160...
Total Blood Cholesterol Levels 160 160 170 150 160 170 155 350 180 155 180 160 150 180 150 180 23.
Using the descriptive statistics analysis for ‘Total Blood Cholesterol Levels’ created for the 16 patients, how does the mean value compare to the median value and the mode value?
a. These three measures of central tendency are similar. b. The mean is higher than the median and the mode. c. The mean is the preferable value to report for this data set. d. None of the above.
- Using the descriptive statistics analysis for ‘Total Blood Cholesterol Levels’ created for 16 patients and looking at the data provided, what is the most appropriate measure of central tendency to report? a. Mode b. Median c. Mean d. None of the above. 9
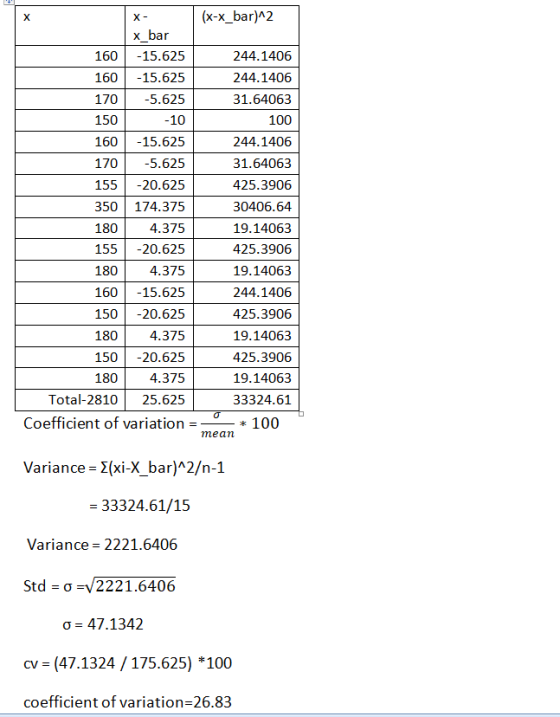
- Using the descriptive statistics analysis for ‘Total Blood Cholesterol Levels’ created for 16 patients, what is the coefficient off variation (CV)? a. 0.27 b. 14.68 c. 0.30 d. 13.04
Homework Answers

Add Answer to:
Total Blood Cholesterol Levels 160 160 170 150 160 170 155 350
180 155 180 160...
Total Blood Cholesterol Levels 160 160 170 150 160 170 155 180 155 180 160 150...
Total Blood Cholesterol Levels 160 160 170 150 160 170 155 180 155 180 160 150 180 150 180 26. In the descriptive statistics analysis for ‘Total Blood Cholesterol Levels’ created for the 15 patients with the removal of the outlier (350), how do these results compare to the analysis for 16 patients that includes the outlier (350)? a. There is a decrease in the mean, standard deviation, and range; no change in the median and mode. b. There is...
- A variable is a. Unit upon which measurements are made b. Data collection form c....
- A variable is a. Unit upon which measurements are made b. Data collection form c. The characteristic being measured d. The realized measurement - For what kind of data are bar graphs best suited? a. Nominal or Ordinal b. Ordinal or Interval c. Nominal or Interval d. Interval or Ratio - Histograms display frequencies for what level of measurement? a. Ordinal b. Interval or Ratio c. Categorical d. Nominal - The term for a value that best describes the...
Nonparametrics Testing baseline 180 136 210 170 140 160 150 110 120 125 230 124 110 164 170 106 1...
 Nonparametrics Testing baseline 180 136 210 170 140 160 150 110 120 125 230 124 110 164 170 106 150 160 128 190 230 142 150 130 152 100 170 100 168 150 152 160 180 final med 156 Nifedipine 126 Nifedipine 230 Nifedipine 150 Nifedipine 120 Nifedipine 164 Nifedipine 140 Nifedipine 112 Nifedipine 120 Nifedipine 120 Nifedipine 170 Nifedipine 134 Nifedipine 116 Nifedipine 144 Nifedipine 170 Nifedipine 124 Nifedipine 136 Nifedipine 140 Nifedipine 110 Propranolol 140 Propranolol 150 Propranolol...
I want you to conduct a hypothesis test for a difference of means for cholesterol levels...
I want you to conduct a hypothesis test for a difference of means for cholesterol levels between male and female students. There are 148 females and 164 males in our sample. You can treat this as a large sample problem and use z-values for confidence intervals and hypothesis tests (however, Excel uses a t-value in anything it calculates). The output from Microsoft Excel is given below to help. Your job will be to find the right numbers in the output...
A food murer moting is now cereales part of a daily diellowers total blood cholesterol levels....
 A food murer moting is now cereales part of a daily diellowers total blood cholesterol levels. The table shows the olood cholesterol levels in miligrams per deciliter of blood of seven patients before eating the coreland hoone year of singers as part of the disse toch oost the meanino Assume the samples are random and dependent and the population is nostrud. Al 0.05, can you conclude that we lowers total blood cholesterol level? Patient Total Blood Cholesterol forel 215 Total...
PPH4801/MPHDHM9 Jan/Feb 2018 16 A study of 100 pabents is perfomed to determine f cholesterol levels...
 PPH4801/MPHDHM9 Jan/Feb 2018 16 A study of 100 pabents is perfomed to determine f cholesterol levels are lowered after 3 months of taking a new drug Cholesterol levels are measured on each individual at the beginning of the study and 3 months later The cholesterol change is calculated the value at 3 months minus the value at the beginning of the study On average the cholesterol levels among these 100 patents decreased by 150 and the standard deviation of the...
Height 180 170 160 150 140 There are no severe outliers within height. 2. Produce the 5-number su...
 Can I get help for questions 6,7,11,12,13,14,15,16,17,18 and
20.
Height 180 170 160 150 140 There are no severe outliers within height. 2. Produce the 5-number summary for Height using the filtered sample. Minimum Value: 140 Q1: 153 Median: 162 Q3: 169 Maximum Value: 186 3. Provide the Normal QQ plot for your sample with the outliers removed Do you think the plot provides evidence for normality? Looking at the plot, I do believe that this does provide evidence for...
Can I get help for questions 6,7,11,12,13,14,15,16,17,18 and
20.
Height 180 170 160 150 140 There are no severe outliers within height. 2. Produce the 5-number summary for Height using the filtered sample. Minimum Value: 140 Q1: 153 Median: 162 Q3: 169 Maximum Value: 186 3. Provide the Normal QQ plot for your sample with the outliers removed Do you think the plot provides evidence for normality? Looking at the plot, I do believe that this does provide evidence for...
Serum Systolic Serum Systolic Serum Systolic Serum Systolic Serum Systolic 04 137 183115 218 145 209 170 195 115 Question 1a: Data a. Use the proportion from question 1a. Test the claim that t...
 Serum Systolic Serum Systolic Serum Systolic Serum Systolic Serum Systolic 04 137 183115 218 145 209 170 195 115 Question 1a: Data a. Use the proportion from question 1a. Test the claim that the Sample 153 127 193 146 173 194 163 201...-174--157 proportion of Asianssi-s than 25%, use 219 ; 1191 163 160 174,160 140 Proportion 0.2 Critical Value 1.645 Margin of Error 0.0658 144 140 145 177 152166175 200 131 Hypotheses: You may write HO and Hl Test...
Sample A SUBJ WTPRE WTPST Sa SEX WTLOSS var 1 165 160 M -5 2 202...
 Sample A SUBJ WTPRE WTPST Sa SEX WTLOSS var 1 165 160 M -5 2 202 200 M -2 3 256 259 M 3 4 155 156 M 1 5 175 162 M -13 6 180 187 M 7 174 172 M -2 8 136 138 M 2 9 168 162 M -6 10 155 155 M 0 11 220 205 M - 15 12 163 153 M -10 13 159 150 M -9 14 253 255 F 15 138...
5 of 8 patients were recruited to analyze the effects of various varia bles in explaining Total Cholesterol (...
 5 of 8 patients were recruited to analyze the effects of various varia bles in explaining Total Cholesterol (mg/dL). Some of the variables included in this study are Age in years at screening, Weight (kg), Gender, Triglyceride (mg/d L), Direct HDL-Cholesterol (mg/dL), Fasting Glucose (mg/dL), and Systolic Blood Pressure (1st reading). A multiple regression was conducted to determine the extent to which Total Cholesterol (mg/dL) can be explained by these variables. Here is the output obta ined when a multiple...
 Nonparametrics Testing baseline 180 136 210 170 140 160 150 110 120 125 230 124 110 164 170 106 150 160 128 190 230 142 150 130 152 100 170 100 168 150 152 160 180 final med 156 Nifedipine 126 Nifedipine 230 Nifedipine 150 Nifedipine 120 Nifedipine 164 Nifedipine 140 Nifedipine 112 Nifedipine 120 Nifedipine 120 Nifedipine 170 Nifedipine 134 Nifedipine 116 Nifedipine 144 Nifedipine 170 Nifedipine 124 Nifedipine 136 Nifedipine 140 Nifedipine 110 Propranolol 140 Propranolol 150 Propranolol...
 A food murer moting is now cereales part of a daily diellowers total blood cholesterol levels. The table shows the olood cholesterol levels in miligrams per deciliter of blood of seven patients before eating the coreland hoone year of singers as part of the disse toch oost the meanino Assume the samples are random and dependent and the population is nostrud. Al 0.05, can you conclude that we lowers total blood cholesterol level? Patient Total Blood Cholesterol forel 215 Total...
 PPH4801/MPHDHM9 Jan/Feb 2018 16 A study of 100 pabents is perfomed to determine f cholesterol levels are lowered after 3 months of taking a new drug Cholesterol levels are measured on each individual at the beginning of the study and 3 months later The cholesterol change is calculated the value at 3 months minus the value at the beginning of the study On average the cholesterol levels among these 100 patents decreased by 150 and the standard deviation of the...
 Can I get help for questions 6,7,11,12,13,14,15,16,17,18 and
20.
Height 180 170 160 150 140 There are no severe outliers within height. 2. Produce the 5-number summary for Height using the filtered sample. Minimum Value: 140 Q1: 153 Median: 162 Q3: 169 Maximum Value: 186 3. Provide the Normal QQ plot for your sample with the outliers removed Do you think the plot provides evidence for normality? Looking at the plot, I do believe that this does provide evidence for...
Can I get help for questions 6,7,11,12,13,14,15,16,17,18 and
20.
Height 180 170 160 150 140 There are no severe outliers within height. 2. Produce the 5-number summary for Height using the filtered sample. Minimum Value: 140 Q1: 153 Median: 162 Q3: 169 Maximum Value: 186 3. Provide the Normal QQ plot for your sample with the outliers removed Do you think the plot provides evidence for normality? Looking at the plot, I do believe that this does provide evidence for...
 Serum Systolic Serum Systolic Serum Systolic Serum Systolic Serum Systolic 04 137 183115 218 145 209 170 195 115 Question 1a: Data a. Use the proportion from question 1a. Test the claim that the Sample 153 127 193 146 173 194 163 201...-174--157 proportion of Asianssi-s than 25%, use 219 ; 1191 163 160 174,160 140 Proportion 0.2 Critical Value 1.645 Margin of Error 0.0658 144 140 145 177 152166175 200 131 Hypotheses: You may write HO and Hl Test...
 Sample A SUBJ WTPRE WTPST Sa SEX WTLOSS var 1 165 160 M -5 2 202 200 M -2 3 256 259 M 3 4 155 156 M 1 5 175 162 M -13 6 180 187 M 7 174 172 M -2 8 136 138 M 2 9 168 162 M -6 10 155 155 M 0 11 220 205 M - 15 12 163 153 M -10 13 159 150 M -9 14 253 255 F 15 138...
 5 of 8 patients were recruited to analyze the effects of various varia bles in explaining Total Cholesterol (mg/dL). Some of the variables included in this study are Age in years at screening, Weight (kg), Gender, Triglyceride (mg/d L), Direct HDL-Cholesterol (mg/dL), Fasting Glucose (mg/dL), and Systolic Blood Pressure (1st reading). A multiple regression was conducted to determine the extent to which Total Cholesterol (mg/dL) can be explained by these variables. Here is the output obta ined when a multiple...
Most questions answered within 3 hours.
-
Aqueous hydrobromic acid HBr reacts with solid sodium hydroxide
NaOH to produce aqueous sodium bromide NaBr...
asked 7 minutes ago -
You dissolve 1.0 mole of a substance in water to a total volume
of 1,000 ml....
asked 12 minutes ago -
A company's total assets at the end of last year were 500,000
and its EBIT was...
asked 17 minutes ago -
Is it redundant to say that a pure substance is homogeneous, or
can it not be...
asked 20 minutes ago -
Already famous by the time he arrived at Princeton University in
1933, Einstein had suggested a...
asked 39 minutes ago -
Suppose the average male brain weight (in grams) is estimated to
be 13201320 grams. A 1905...
asked 48 minutes ago -
For each molecular substance (a) H3PO2 and (b) C6H5NH2,
calculate its molecular mass and write a...
asked 41 minutes ago -
The inheritance of color blindness in humans is due to a
recessive gene located on the...
asked 44 minutes ago -
Aqueous sulfuric acid (H2SO4) reacts with solid sodium hydroxide
(NaOH) to produce aqueous sodium sulfate (Na2SO4)...
asked 45 minutes ago -
QUESTION 25:
Find the pure binary representation of the following decimal
value: You DO NOT need...
asked 48 minutes ago -
The English mathematician John Kerrich tossed a coin
10,000 times and obtained 5067 heads.
a. calculate...
asked 1 hour ago -
13. Use the Student's t-distribution to find the t-value for
each of the given scenarios. Round...
asked 1 hour ago