Please do not hand write or abbreviate any of the written statements, please. It makes it very difficult to decipher. Thank you!
Homework Answers
A) The M1 money supply is the sum of the rows A, E and G respectively for each year. i.e.
Total M1 money stock
2015: 900+1000+4= 1904 similarly for
2016: 920+ 972+4=1896
2017: 925+980+3= 1908
2018: 931+993+2=1926
The M2 money supply is the sum of all components i.e. from A to G for each year.
Note: 3-months treasury bills are not considered of M1 and M2 money supply.
Total M2 money stock
2015: 900+680+5500+1214+1000+830+4= 10128
2016: 920+681+5780+1245+972+861+4= 10463
2017: 925+679+5968+1274+980+1123+3= 10952
2018: 931+688+6105+1329+993+1566+2= 11614
Growth Rate= (difference between years / earlier years) * 100
M1 growth rate 2015 to 2016:
(1896-1904) / 1904*100= (-8/1904)*100 = -0.42%
M1 growth rate 2016 to 2017:
(1908-1896)/1896*100 = 12/1896*100= 0.63%
M1 growth rate 2017 to 2018:
(1926-1908)/1908*100 = 18/1908*100 = 0.94%
M2 growth rate 2015 to 2016:
(10463-10128)/10128*100 = 335/10128*100 = 3.3%
M2 growth rate 2016 to 2017:
(10952-10463)/10463*100 = 489/10463*100 = 4.6%
M2 growth rate 2017 to 2018:
(11614-10952)/10952*100 = 662/10952*100 = 6.04%
B) The growth rate of M1 and M2 money supply are so different because M1 is the narrow measure of money and includes less components into it where as M2 is a broad measures of money supply and it includes M1 components of money supply as well as other components too.
Add Answer to:
Please do not hand write or abbreviate any of the written
statements, please. It makes it...
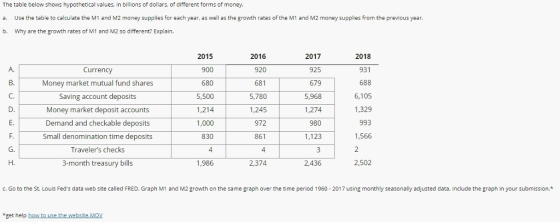
The table below shows hypothetical values, in billions of dollars, of different forms of money. a....
 The table below shows hypothetical values, in billions of dollars, of different forms of money. a. Use the table to calculate the M1 and M2 money supplies for each year, as well as the growth rates of the M1 and M2 money supplies from the previous year b. Why are the growth rates of M1 and M2 so different? Explain. 2015 900 680 5,500 1,214 1,000 830 4 1,986 2016 920 681 5,780 1,245 972 861 4 2,374 2017 925...
The table to the right shows hypothetical values, in billions of dollars. 2009 2010 2011 2012...
 The table to the right shows hypothetical values, in billions of dollars. 2009 2010 2011 2012 950 965 971 975 A. Currency Use the table to calculate the M1 and M2 money supply for each year. (Enter your responses rounded to the nearest dollar) B. Money market C. Saving account D. Money market E. Demand and mutual fund shares 676 677 675 684 deposits deposit accounts 1,214 1,245 1,274 1,329 checkable deposits 980 952 960 973 2009 5300 5,580 5,768...
The table to the right shows hypothetical values, in billions of dollars. Use the table to...
 The table to the right shows hypothetical values, in billions of dollars. Use the table to calculate the M1 and M2 money supply for each year. (Enter your responses rounded to the nearest dollar) 2009 920 675 2010 935 685 2011 2012 940 946 683 692 5,500 5,780 5,968 6,105 2009 1903 10103 2010 1890 10442 2011 1902 10931 Total M1 Total M2 2012 1920 11593 1.205 1,236 1,265 1,320 A Currency B. Money market mutual fund shares C. Saving...
 The table below shows hypothetical values, in billions of dollars, of different forms of money. a. Use the table to calculate the M1 and M2 money supplies for each year, as well as the growth rates of the M1 and M2 money supplies from the previous year b. Why are the growth rates of M1 and M2 so different? Explain. 2015 900 680 5,500 1,214 1,000 830 4 1,986 2016 920 681 5,780 1,245 972 861 4 2,374 2017 925...
 The table to the right shows hypothetical values, in billions of dollars. 2009 2010 2011 2012 950 965 971 975 A. Currency Use the table to calculate the M1 and M2 money supply for each year. (Enter your responses rounded to the nearest dollar) B. Money market C. Saving account D. Money market E. Demand and mutual fund shares 676 677 675 684 deposits deposit accounts 1,214 1,245 1,274 1,329 checkable deposits 980 952 960 973 2009 5300 5,580 5,768...
 The table to the right shows hypothetical values, in billions of dollars. Use the table to calculate the M1 and M2 money supply for each year. (Enter your responses rounded to the nearest dollar) 2009 920 675 2010 935 685 2011 2012 940 946 683 692 5,500 5,780 5,968 6,105 2009 1903 10103 2010 1890 10442 2011 1902 10931 Total M1 Total M2 2012 1920 11593 1.205 1,236 1,265 1,320 A Currency B. Money market mutual fund shares C. Saving...
Most questions answered within 3 hours.
-
Write which type of radiation (alpha, beta, gamma, or positron)
matches the following
descriptors. Each type...
asked 11 minutes ago -
You place a block of
ice (mass of 3 kg) into a test chamber filled with...
asked 9 minutes ago -
Describe and draw the mechanism for the formation of the
Grignard reagent with 2-bromopropane as the...
asked 11 minutes ago -
Work out a care plan for Rex to help her better manage
her medical conditions. Provide...
asked 22 minutes ago -
The historical returns on a balanced portfolio have had an
average return of 11% and a...
asked 26 minutes ago -
Sulfuric acid (250.0mL) is titrated with 176.5 mL 2.4 M NaOH to
an equivalence point (the...
asked 38 minutes ago -
The quality control manager of a cookie company is inspecting a
batch of chocolate-chip cookies that...
asked 39 minutes ago -
How can we identify what the horizontal force is when looking at
a merry go round?...
asked 1 hour ago -
While Dime Community Bank is based in Brooklyn; management has
decided to focus its lending activity...
asked 1 hour ago -
1) Earnings functions, whereby the log of earnings is regressed
on years of education, years of...
asked 1 hour ago -
Bruno Corporation is involved in the business of injection
molding of plastics. It is considering the...
asked 1 hour ago -
What would be the vapor pressure of water at 96°C above a
solution made by dissolving...
asked 1 hour ago