
Homework Answers
Add Answer to:
need help
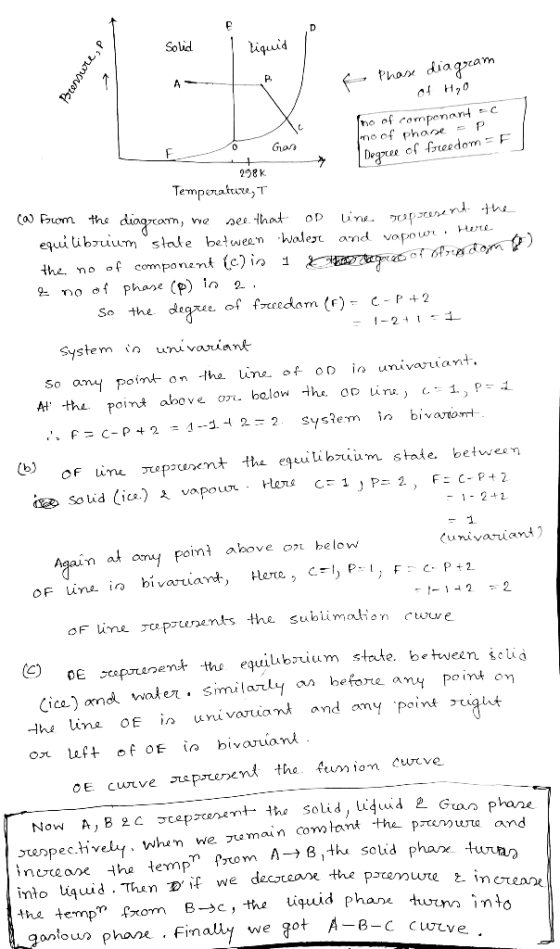
10. In the following phase diagram, describe the progression from point A to point...
please i need help with all questions 5. List the following cubic packing structures from least (1) to most (3) eff...
 please i need help with all questions
5. List the following cubic packing structures from least (1) to most (3) efficient structures (in terms of "packing efficiency"; be sure you can also sketch out the face and packing of these cubic structures, as well as calculate the packing efficiency of each one yourself. Do not simply memorize the packing efficiency values!) a. Simple Cubic b. Body-centered cubic c. Face-centered cubic 6. Calculate the mass of a single unit cell of...
please i need help with all questions
5. List the following cubic packing structures from least (1) to most (3) efficient structures (in terms of "packing efficiency"; be sure you can also sketch out the face and packing of these cubic structures, as well as calculate the packing efficiency of each one yourself. Do not simply memorize the packing efficiency values!) a. Simple Cubic b. Body-centered cubic c. Face-centered cubic 6. Calculate the mass of a single unit cell of...
9. The phase diagram for Xenon is provided opposite Liquid What phase change(s) occur as Xenon...
 9. The phase diagram for Xenon is provided opposite Liquid What phase change(s) occur as Xenon is cooled from room temperature to -150°C at 2 atm pressure 100 Solid 10 Deposition only Condensation then Freezing а) b) Gas c) Melting then Vaporisation 0.1 d) Condensation then Sublimation 0.01 Sublimation only е) -180 -120 -60 0 60 Temperature (C) 10. A schematic phase diagram is shown below. The temperature and pressure defining the (solid,liquid,gas) triple point (Tip,Pp) and the critical point...
need help 9. On the phase diagram provided, indicate where each term is applied: (click-and-drag the...
 need help
9. On the phase diagram provided, indicate where each term is applied: (click-and-drag the associated terms to the diagram in the online submission) a. Melting/freezing b. Boiling/condensation C. Sublimation/deposition d. Triple point c. Critical point f. Solid phase g. Liquid phase h. Gas phase i. Pressure axis j. Temperature axis Fall 2019 CHEM 1001 A 7:30 PM - Mondays November 18+
need help
9. On the phase diagram provided, indicate where each term is applied: (click-and-drag the associated terms to the diagram in the online submission) a. Melting/freezing b. Boiling/condensation C. Sublimation/deposition d. Triple point c. Critical point f. Solid phase g. Liquid phase h. Gas phase i. Pressure axis j. Temperature axis Fall 2019 CHEM 1001 A 7:30 PM - Mondays November 18+
The phase diagram for a pure substance is shown below. A substance at point H is:...
 The phase diagram for a pure substance is shown below. A substance at point H is: 760 •A . •G Pressure (mm Hg) 0 Temperature (°C) O in the gas phase O in the solid phase O in the liquid phase O at equilibrium between solid and liquid at equilibrium between liquid and gas
GENERAL FEATURES OF A PHASE DIAGRAM; HYBRID ORBITALS AND FORMAL CHARGE MODEL 1 solid structure liquid...
 GENERAL FEATURES OF A PHASE DIAGRAM; HYBRID ORBITALS AND FORMAL CHARGE MODEL 1 solid structure liquid rc Pressure in atm solid structure Il Temperature in K — KEY QUESTIONS 1. What quantities are plotted on the x-and y-axes of a phase diagram? 2. 2. How many different phases are shown by the phase diagram in the model? b. What are the labels used to identify them? 3. What do the solid lines in a phase diagram represent 4. 2. How...
please help Study the following phase diagram of Substance X. 2.4 pressure (atm) solid liquid gas...
 please help
Study the following phase diagram of Substance X. 2.4 pressure (atm) solid liquid gas 400 600 temperature (K) Use this diagram to answer the following questions. Suppose a small sample of pure X is held at -9. °C and 1.1 atm. What will be the state of the sample? ✓ (chole one) solid liquid gas Suppose the temperature is held constant at -9. °C but the pressure is decreased by 0.7 atm. What will happen to the sample?...
please help
Study the following phase diagram of Substance X. 2.4 pressure (atm) solid liquid gas 400 600 temperature (K) Use this diagram to answer the following questions. Suppose a small sample of pure X is held at -9. °C and 1.1 atm. What will be the state of the sample? ✓ (chole one) solid liquid gas Suppose the temperature is held constant at -9. °C but the pressure is decreased by 0.7 atm. What will happen to the sample?...
Use the phase diagram of Substance x below to find the boiling point of X when...
 Use the phase diagram of Substance x below to find the boiling point of X when the pressure on the liquid is 1.1 atm. solid pressure (atm) liquid gas temperature (K) Note: your answer must be within 25 °C of the exact answer to be graded correct. X 5 ?
2. Use the following data to prepare a phase diagram of 02. triple point boiling point...
 2. Use the following data to prepare a phase diagram of 02. triple point boiling point melting point critical point vapor pressure of solid T (K) S4.4 90.2 p (ba) 0.0015 10133 1.0133 54.1 154.6 50.43 0.0013 54.8 vapor pressure of liquid T (K) 60 p (bar) 0.0071 0.062 0.301 0.994 2.542 5.43410.216 17.478 27.865 42.190 70 80 90 100 110 120 130 140 150
Considering the phase diagram shown below for an unspecified substance, which of the following statements is true...
 Considering the phase diagram shown below for an unspecified substance, which of the following statements is true? Liq Pressure Temperature O Process M corresponds to evaporation It is not possible to find the solid and gas in equilibrium at any temperature. ooooo The point labeled P is the critical point. The density of the liquid is less than the density of the solid When the solid and liquid are at equilibrium, process N stops completely
Refer to the following phase diagram (not to scale!) for hydrogen: 12.8 1.00 atm 0.071 13.9...
 Refer to the following phase diagram (not to scale!) for hydrogen: 12.8 1.00 atm 0.071 13.9 14.0 20.3 33.2 T Kelvin A sample of hydrogen at a pressure of 1.00 atm and a temperature of 5.90 K is heated at constant pressure to a temperature of 61.4 K. Which of the following are true? Choose all that apply The sample is initially a liquid. The final state of the substance is a gas. One or more phase changes will occur....
 please i need help with all questions
5. List the following cubic packing structures from least (1) to most (3) efficient structures (in terms of "packing efficiency"; be sure you can also sketch out the face and packing of these cubic structures, as well as calculate the packing efficiency of each one yourself. Do not simply memorize the packing efficiency values!) a. Simple Cubic b. Body-centered cubic c. Face-centered cubic 6. Calculate the mass of a single unit cell of...
please i need help with all questions
5. List the following cubic packing structures from least (1) to most (3) efficient structures (in terms of "packing efficiency"; be sure you can also sketch out the face and packing of these cubic structures, as well as calculate the packing efficiency of each one yourself. Do not simply memorize the packing efficiency values!) a. Simple Cubic b. Body-centered cubic c. Face-centered cubic 6. Calculate the mass of a single unit cell of...
 9. The phase diagram for Xenon is provided opposite Liquid What phase change(s) occur as Xenon is cooled from room temperature to -150°C at 2 atm pressure 100 Solid 10 Deposition only Condensation then Freezing а) b) Gas c) Melting then Vaporisation 0.1 d) Condensation then Sublimation 0.01 Sublimation only е) -180 -120 -60 0 60 Temperature (C) 10. A schematic phase diagram is shown below. The temperature and pressure defining the (solid,liquid,gas) triple point (Tip,Pp) and the critical point...
 need help
9. On the phase diagram provided, indicate where each term is applied: (click-and-drag the associated terms to the diagram in the online submission) a. Melting/freezing b. Boiling/condensation C. Sublimation/deposition d. Triple point c. Critical point f. Solid phase g. Liquid phase h. Gas phase i. Pressure axis j. Temperature axis Fall 2019 CHEM 1001 A 7:30 PM - Mondays November 18+
need help
9. On the phase diagram provided, indicate where each term is applied: (click-and-drag the associated terms to the diagram in the online submission) a. Melting/freezing b. Boiling/condensation C. Sublimation/deposition d. Triple point c. Critical point f. Solid phase g. Liquid phase h. Gas phase i. Pressure axis j. Temperature axis Fall 2019 CHEM 1001 A 7:30 PM - Mondays November 18+
 The phase diagram for a pure substance is shown below. A substance at point H is: 760 •A . •G Pressure (mm Hg) 0 Temperature (°C) O in the gas phase O in the solid phase O in the liquid phase O at equilibrium between solid and liquid at equilibrium between liquid and gas
 GENERAL FEATURES OF A PHASE DIAGRAM; HYBRID ORBITALS AND FORMAL CHARGE MODEL 1 solid structure liquid rc Pressure in atm solid structure Il Temperature in K — KEY QUESTIONS 1. What quantities are plotted on the x-and y-axes of a phase diagram? 2. 2. How many different phases are shown by the phase diagram in the model? b. What are the labels used to identify them? 3. What do the solid lines in a phase diagram represent 4. 2. How...
 please help
Study the following phase diagram of Substance X. 2.4 pressure (atm) solid liquid gas 400 600 temperature (K) Use this diagram to answer the following questions. Suppose a small sample of pure X is held at -9. °C and 1.1 atm. What will be the state of the sample? ✓ (chole one) solid liquid gas Suppose the temperature is held constant at -9. °C but the pressure is decreased by 0.7 atm. What will happen to the sample?...
please help
Study the following phase diagram of Substance X. 2.4 pressure (atm) solid liquid gas 400 600 temperature (K) Use this diagram to answer the following questions. Suppose a small sample of pure X is held at -9. °C and 1.1 atm. What will be the state of the sample? ✓ (chole one) solid liquid gas Suppose the temperature is held constant at -9. °C but the pressure is decreased by 0.7 atm. What will happen to the sample?...
 Use the phase diagram of Substance x below to find the boiling point of X when the pressure on the liquid is 1.1 atm. solid pressure (atm) liquid gas temperature (K) Note: your answer must be within 25 °C of the exact answer to be graded correct. X 5 ?
 2. Use the following data to prepare a phase diagram of 02. triple point boiling point melting point critical point vapor pressure of solid T (K) S4.4 90.2 p (ba) 0.0015 10133 1.0133 54.1 154.6 50.43 0.0013 54.8 vapor pressure of liquid T (K) 60 p (bar) 0.0071 0.062 0.301 0.994 2.542 5.43410.216 17.478 27.865 42.190 70 80 90 100 110 120 130 140 150
 Considering the phase diagram shown below for an unspecified substance, which of the following statements is true? Liq Pressure Temperature O Process M corresponds to evaporation It is not possible to find the solid and gas in equilibrium at any temperature. ooooo The point labeled P is the critical point. The density of the liquid is less than the density of the solid When the solid and liquid are at equilibrium, process N stops completely
 Refer to the following phase diagram (not to scale!) for hydrogen: 12.8 1.00 atm 0.071 13.9 14.0 20.3 33.2 T Kelvin A sample of hydrogen at a pressure of 1.00 atm and a temperature of 5.90 K is heated at constant pressure to a temperature of 61.4 K. Which of the following are true? Choose all that apply The sample is initially a liquid. The final state of the substance is a gas. One or more phase changes will occur....
Most questions answered within 3 hours.
-
Problem: Patient Fees C++
You are to write a program that computes a patient’s bill for...
asked 1 hour ago -
In a population of interest, we know that, 77% drink coffee, and
23% drink tea. Assume...
asked 1 hour ago -
Given that f(x) = e-(x-1) for x > 1, determine the following
probabilities:
a) P(X <...
asked 1 hour ago -
A mechanic pushes a 2.60 ✕ 103-kg car from rest to a speed of v,
doing...
asked 1 hour ago -
International information systems result in all of the following
except:
A. improved quality of information flow....
asked 1 hour ago -
The president of the retailer Prime Products has just approached
the company’s bank with a request...
asked 1 hour ago -
If the carrying amount is $200,000 and recoverable amount is
$205000, the impairment amount is:
Select...
asked 1 hour ago -
The correlation is inappropriate as a measure of association
between two quantitative variables (you may select...
asked 1 hour ago -
USE THE DATA IN THE TABLE BELOW TO ANSWER QUESTIONS 19 – 24
(Assume all account...
asked 1 hour ago -
Mahaley, Inc., manufactures and sells two products: Product Q9
and Product F0. Data concerning the expected...
asked 2 hours ago -
To measure the current through one branch of a parallel circuit,
the meter is connected ________....
asked 2 hours ago -
a)
The following table shows the profile, by the math section of
the SAT Reasoning Test,...
asked 2 hours ago