


Homework Answers
1.
| Cost of goods available for Sales | $ 95,280 | |
| Number of units available for sale | 1,930 | units |
2.
| Number of units in ending inventory | 440 units |
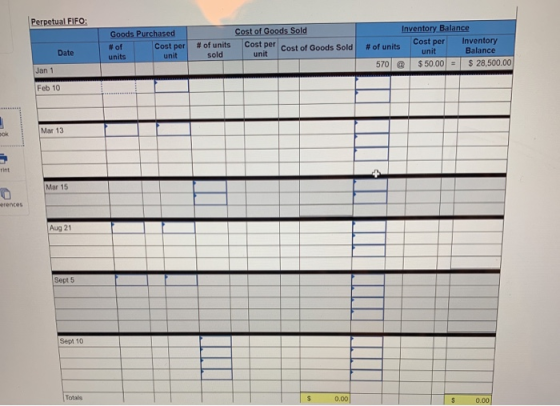
3. Perpetual FIFO:
| Goods Purchased | Cost of Goods Sold | Inventory Balance | |||||||
| Date | No. of Units | Cost per Unit | Amount | No. of Units | Cost per Unit | Amount | No. of Units | Cost per Unit | Amount |
| Jan 1 | 570 | $ 50 | $ 28,500 | ||||||
| Feb 10 | 380 | $ 47 | 17,860 |
570 380 |
50 47 |
28,500 17,860 |
|||
| 950 | 46,360 | ||||||||
| Mar 13 | 190 | 35 | 6,650 |
570 380 190 |
50 47 35 |
28,500 17,860 6,650 |
|||
| 1,140 | 53,010 | ||||||||
| Mar 15 |
570 130 |
50 47 |
28,500 6,110 |
250 190 |
47 35 |
11,750 6,650 |
|||
| 700 | 34,610 | 440 | 18,400 | ||||||
| Aug 21 | 200 | 55 | 11,000 |
250 190 200 |
47 35 55 |
11,750 6,650 11,000 |
|||
| 640 | 29,400 | ||||||||
| Sep 5 | 590 | 53 | 31,270 |
250 190 200 590 |
47 35 55 53 |
11,750 6,650 11,000 31,270 |
|||
| 1,230 | 60,670 | ||||||||
| Sep 10 |
250 190 200 150 |
47 35 55 53 |
11,750 6,650 11,000 7,950 |
440 | 53 | 23,320 | |||
| 790 | 37,350 | ||||||||
| Totals | 1,360 | 66,780 | 1,490 | 71,960 | 440 | 53 | 23,320 | ||
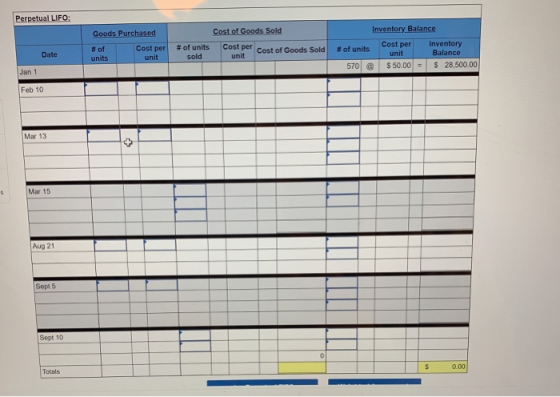
Perpetual LIFO:
| Goods Purchased | Cost of Goods Sold | Inventory Balance | |||||||
| Date | No. of Units | Unit Cost | Total Cost | No. of Units | Unit Cost | Total Cost | No. of Units | Unit Cost | Total Cost |
| Jan 1 | 570 | $ 50 | $28,500 | ||||||
| Feb 10 | 380 | 47 | 17,860 |
570 380 |
50 47 |
28,500 17,860 |
|||
| 950 | 46,360 | ||||||||
| Mar 13 | 190 | 35 | 6,650 |
570 380 190 |
50 47 35 |
28,500 17,860 6,650 |
|||
| 1,140 | 53,010 | ||||||||
| Mar 15 |
190 380 130 |
35 47 50 |
6,650 17,860 6,500 |
440 |
50 | 22,000 | |||
| 700 | 31,010 | 440 | 50 | 22,000 | |||||
| Aug 21 | 200 | 55 | 11,000 |
440 200 |
50 55 |
22,000 11,000 |
|||
| 640 | 33,000 | ||||||||
| Sep 5 | 590 | 53 | 31,270 |
440 200 590 |
50 55 53 |
22,000 11,000 31,270 |
|||
| 1,230 | 64,270 | ||||||||
| Sep 10 |
590 200 |
53 55 |
31,270 11,000 |
440 | 50 | 22,000 | |||
| 790 | 42,270 | ||||||||
| Totals | 1,360 | 66,780 | 1,490 | 73,280 | 440 | 22,000 | |||
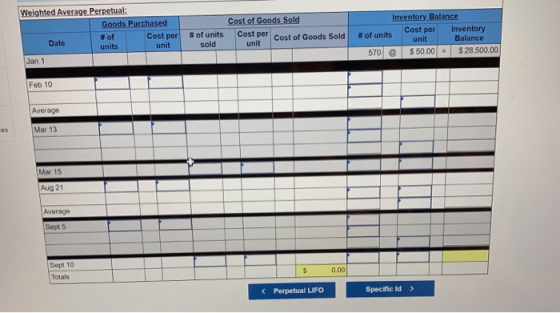
Weighted Average Perpetual:
| Goods Purchased | Cost of Goods Sold | Inventory Balance | |||||||
| Date | No. of Units | Unit Cost | Total Cost | No. of Units | Unit Cost | Total Cost | No. of Units | Unit Cost | Total Cost |
| Jan 1 | 570 | $ 50 | $ 28,500 | ||||||
| Feb 10 | 380 | $ 47 | $17,860 |
570 380 |
50 47 |
28,500 17,860 |
|||
| 950 | 48.80 | 46,360 | |||||||
| Mar 13 | 190 | 35 | 6,650 |
950 190 |
48.80 35 |
46,360 6,650 |
|||
| 1,140 | 46.50 | 53,010 | |||||||
| Mar 15 | 700 | 46.50 | 32,550 | 440 | 46.50 | 20,460 | |||
| Aug 21 | 200 | 55 | 11,000 |
440 200 |
46.50 55 |
20,460 11,000 |
|||
| 640 | 49.16 | 31,460 | |||||||
| Sep 5 | 590 | 53 | 31,270 |
640 590 |
49.16 53 |
31,460 31,270 |
|||
| 1,230 | 51 | 62,730 | |||||||
| Sep 10 | 790 | 51 | 40,290 | 440 | 51 | 22,440 | |||
| Totals | 1,360 | 66,780 | 1,490 | 72,840 | 440 | 51 | 22,440 | ||
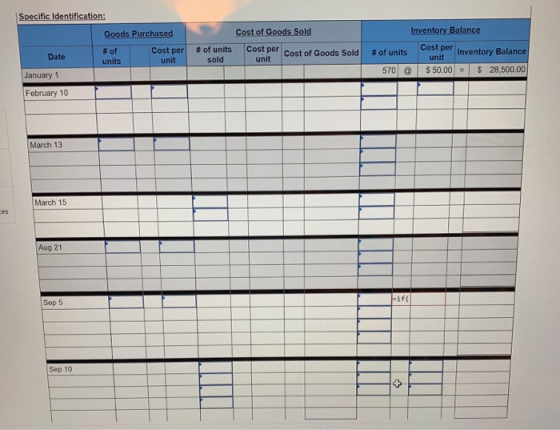
Specific Identification :
| Goods Purchased | Cost of Goods Sold | Inventory Balance | |||||||
| Date | No. of Units | Unit Cost | Total Cost | No. of Units | Unit Cost | Total Cost | No. of Units |
Unit Cost |
Total Cost |
| Jan 1 | 570 | $ 50 | $28,500 | ||||||
| Feb 10 | 380 | $ 47 | $17,860 |
570 380 |
50 47 |
28,500 17,860 |
|||
| 950 | 46,360 | ||||||||
| Mar 13 | 190 | 35 | 6,650 |
570 380 190 |
50 47 35 |
28,500 17,860 6,650 |
|||
| 1.140 | 53,010 | ||||||||
| Mar 15 | 700 | ||||||||
| Aug 21 | 200 | 55 | 11,000 | ||||||
| Sep 5 | 590 | 53 | 31,270 | ||||||
| Totals | 1,360 | $66,780 | 1,490 | 72,460 | 440 | 22,820 | |||
4.
| FIFO | LIFO | Weighted Average | Specific Identification | |
| Sales | $111,750 | $111,750 | $ 111,750 | $ 111,750 |
| Less: Cost of Goods Sold | 71,960 | 73,280 | 72,840 | 72,460 |
| Gross Profit | $39,790 | $ 38,470 | $ 38,910 | $ 39,2905 |
5. FIFO.
Add Answer to:
FIFO, LIFO, WAV, and Specific Identification. The top portion
includes the units at cost and units...
Compute the cost assigned to ending inventory using (a) FIFO, (b) LIFO, (c) weighted average, and...
 Compute the cost assigned to ending inventory using (a) FIFO,
(b) LIFO, (c) weighted average, and (d) specific identification.
For specific identification, units sold consist of 600 units from
beginning inventory, 380 from the February 10 purchase, 120 from
the March 13 purchase, 130 from the August 21 purchase, and 205
from the September 5 purchase. (Round your average cost per unit to
2 decimal places.)
Montoure Company uses a perpetual inventory system. It entered into the following calendar-year purchases...
Compute the cost assigned to ending inventory using (a) FIFO,
(b) LIFO, (c) weighted average, and (d) specific identification.
For specific identification, units sold consist of 600 units from
beginning inventory, 380 from the February 10 purchase, 120 from
the March 13 purchase, 130 from the August 21 purchase, and 205
from the September 5 purchase. (Round your average cost per unit to
2 decimal places.)
Montoure Company uses a perpetual inventory system. It entered into the following calendar-year purchases...
Montoure Company uses a perpetual inventory system. It entered into the following calendar-year purchases and sales...
 Montoure Company uses a perpetual inventory system. It entered into the following calendar-year purchases and sales transactions Date Activities Units Acquired at Cost Units Sold at Retail Jan. 1 Beginning inventory 600 units $40 per unit Feb. 10 Purchase 400 units@ $37 per unit Mar. 13 Purchase 190 units@ $15 per unit Mar. 15 Sales 805 units@ $70 per unit Aug. 21 Purchase 190 units @ $45 per unit Sept. 5 Purchase 550 units @ $43 per unit Sept. 10...
PLEASE ANSWER THE FOLLOWING ACCORDING TO THEIR RESPECTIVE TABLES; {THE BLANK BLUE HIGHLIGHT AROUND EACH UNIT...
 PLEASE ANSWER THE FOLLOWING ACCORDING TO THEIR
RESPECTIVE TABLES; {THE BLANK BLUE HIGHLIGHT AROUND EACH UNIT ARE
REQUIRED}
THANK YOU!!
Montoure Company uses a perpetual inventory system. It entered into the following calendar-year purchases and sales transactions Units sold at Retail Units Acquired at Cost 600 units @ $40 per unit 360 units @ $37 per unit 150 units @ $25 per unit Date Activities Jan. 1 Beginning inventory Feb. 10 Purchase Mar. 13 Purchase Mar. 15 Sales Aug. 21...
PLEASE ANSWER THE FOLLOWING ACCORDING TO THEIR
RESPECTIVE TABLES; {THE BLANK BLUE HIGHLIGHT AROUND EACH UNIT ARE
REQUIRED}
THANK YOU!!
Montoure Company uses a perpetual inventory system. It entered into the following calendar-year purchases and sales transactions Units sold at Retail Units Acquired at Cost 600 units @ $40 per unit 360 units @ $37 per unit 150 units @ $25 per unit Date Activities Jan. 1 Beginning inventory Feb. 10 Purchase Mar. 13 Purchase Mar. 15 Sales Aug. 21...
Montoure Company uses a perpetual inventory system. It entered into the following calendar-year purchases Date Activities...
 Montoure Company uses a perpetual inventory system. It entered into the following calendar-year purchases Date Activities Units Acquired at Cost Units sold at Retail Jan. 1 Beginning inventory 540 units @ $40 per unit Feb. 10 Purchase 320 units @ $36 per unit Mar. 13 Purchase 100 units @ $24 per unit Mar. 15 Sales 650 units @ $85 per unit Aug. 21 Purchase 120 units @ $45 per unit Sept. 5 Purchase 520 units @ $41 per unit Sept....
Montoure Company uses a perpetual inventory system. It entered into the following calendar-year purchases and sales...
 Montoure Company uses a perpetual inventory system. It entered into the following calendar-year purchases and sales transactions Units Sold at Retail Units Acquired at Cost 620 units@ $45 per unit 310 units @ $42 per unit 120 units @ $30 per unit Date Activities Jan. 1 Beginning inventory Feb. 10 Purchase Mar. 13 Purchase Mar. 15 Sales Aug. 21 Purchase Sept. 5 Purchase Sept. 10 Sales Totals 770 units@ $85 per unit 190 units @ $50 per unit 520 units...
Montoure Company uses a perpetual inventory system. It entered into the following calendar-year purchases and sales...
 Montoure Company uses a perpetual inventory system. It entered
into the following calendar-year purchases and sales
transactions
Date
Activities
Units Acquired at Cost
Units Sold at Retail
Jan.
1
Beginning inventory
620
units
@ $45 per unit
Feb.
10
Purchase
310
units
@ $42 per unit
Mar.
13
Purchase
120
units
@ $30 per unit
Mar.
15
Sales
770
units
@ $85 per unit
Aug.
21
Purchase
190
units
@ $50 per unit
Sept.
5
Purchase
520
units
@ $48...
Montoure Company uses a perpetual inventory system. It entered
into the following calendar-year purchases and sales
transactions
Date
Activities
Units Acquired at Cost
Units Sold at Retail
Jan.
1
Beginning inventory
620
units
@ $45 per unit
Feb.
10
Purchase
310
units
@ $42 per unit
Mar.
13
Purchase
120
units
@ $30 per unit
Mar.
15
Sales
770
units
@ $85 per unit
Aug.
21
Purchase
190
units
@ $50 per unit
Sept.
5
Purchase
520
units
@ $48...
Montoure Company uses a perpetual Inventory system. It entered into the following calendar year purchases and...
 Montoure Company uses a perpetual Inventory system. It entered into the following calendar year purchases and sales transactions. Units Sold at Retail Units Acquired at Cost 600 units $45 per unit 400 units $42 per unit 200 units $27 per unit Date Activities Jan. 1 Beginning inventory Feb. 10 Purchase Mar. 13 Purchase Mar. 15 Sales Aug. 21 Purchase Sept. 5 Purchase Sept. 10 Sales Totals 800 units $75 per unit 100 units $50 per unit 500 units @ $46...
Montoure Company uses a perpetual Inventory system. It entered into the following calendar-year purchases and sales...
 Montoure Company uses a perpetual Inventory system. It entered into the following calendar-year purchases and sales transactions Units sold at Retail Unite Aequired at Cost 680 units 540 per unit 320 units @ $35 per unit 100 units $23 per unit Date Activities Jan. Beginning inventory Feb. 10 Purchase Mar. 13 Purchase Mar. 15 Sales Aug. 21 Purchase Sept. 5 Purchase Sept. 10 Sales Totals 720 unitse $75 per unit 130 units 490 units $45 per unit $41 per unit...
Montoure Company uses a perpetual inventory system. It entered into the following calendar-year purchases and sales...
 Montoure Company uses a perpetual inventory system. It entered
into the following calendar-year purchases and sales
transactions
Date
Activities
Units Acquired at Cost
Units Sold at Retail
Jan.
1
Beginning inventory
600
units
@ $35 per unit
Feb.
10
Purchase
300
units
@ $32 per unit
Mar.
13
Purchase
150
units
@ $20 per unit
Mar.
15
Sales
725
units
@ $80 per unit
Aug.
21
Purchase
190
units
@ $40 per unit
Sept.
5
Purchase
540
units
@ $37...
Montoure Company uses a perpetual inventory system. It entered
into the following calendar-year purchases and sales
transactions
Date
Activities
Units Acquired at Cost
Units Sold at Retail
Jan.
1
Beginning inventory
600
units
@ $35 per unit
Feb.
10
Purchase
300
units
@ $32 per unit
Mar.
13
Purchase
150
units
@ $20 per unit
Mar.
15
Sales
725
units
@ $80 per unit
Aug.
21
Purchase
190
units
@ $40 per unit
Sept.
5
Purchase
540
units
@ $37...
 Compute the cost assigned to ending inventory using (a) FIFO,
(b) LIFO, (c) weighted average, and (d) specific identification.
For specific identification, units sold consist of 600 units from
beginning inventory, 380 from the February 10 purchase, 120 from
the March 13 purchase, 130 from the August 21 purchase, and 205
from the September 5 purchase. (Round your average cost per unit to
2 decimal places.)
Montoure Company uses a perpetual inventory system. It entered into the following calendar-year purchases...
Compute the cost assigned to ending inventory using (a) FIFO,
(b) LIFO, (c) weighted average, and (d) specific identification.
For specific identification, units sold consist of 600 units from
beginning inventory, 380 from the February 10 purchase, 120 from
the March 13 purchase, 130 from the August 21 purchase, and 205
from the September 5 purchase. (Round your average cost per unit to
2 decimal places.)
Montoure Company uses a perpetual inventory system. It entered into the following calendar-year purchases...
 Montoure Company uses a perpetual inventory system. It entered into the following calendar-year purchases and sales transactions Date Activities Units Acquired at Cost Units Sold at Retail Jan. 1 Beginning inventory 600 units $40 per unit Feb. 10 Purchase 400 units@ $37 per unit Mar. 13 Purchase 190 units@ $15 per unit Mar. 15 Sales 805 units@ $70 per unit Aug. 21 Purchase 190 units @ $45 per unit Sept. 5 Purchase 550 units @ $43 per unit Sept. 10...
 PLEASE ANSWER THE FOLLOWING ACCORDING TO THEIR
RESPECTIVE TABLES; {THE BLANK BLUE HIGHLIGHT AROUND EACH UNIT ARE
REQUIRED}
THANK YOU!!
Montoure Company uses a perpetual inventory system. It entered into the following calendar-year purchases and sales transactions Units sold at Retail Units Acquired at Cost 600 units @ $40 per unit 360 units @ $37 per unit 150 units @ $25 per unit Date Activities Jan. 1 Beginning inventory Feb. 10 Purchase Mar. 13 Purchase Mar. 15 Sales Aug. 21...
PLEASE ANSWER THE FOLLOWING ACCORDING TO THEIR
RESPECTIVE TABLES; {THE BLANK BLUE HIGHLIGHT AROUND EACH UNIT ARE
REQUIRED}
THANK YOU!!
Montoure Company uses a perpetual inventory system. It entered into the following calendar-year purchases and sales transactions Units sold at Retail Units Acquired at Cost 600 units @ $40 per unit 360 units @ $37 per unit 150 units @ $25 per unit Date Activities Jan. 1 Beginning inventory Feb. 10 Purchase Mar. 13 Purchase Mar. 15 Sales Aug. 21...
 Montoure Company uses a perpetual inventory system. It entered into the following calendar-year purchases Date Activities Units Acquired at Cost Units sold at Retail Jan. 1 Beginning inventory 540 units @ $40 per unit Feb. 10 Purchase 320 units @ $36 per unit Mar. 13 Purchase 100 units @ $24 per unit Mar. 15 Sales 650 units @ $85 per unit Aug. 21 Purchase 120 units @ $45 per unit Sept. 5 Purchase 520 units @ $41 per unit Sept....
 Montoure Company uses a perpetual inventory system. It entered into the following calendar-year purchases and sales transactions Units Sold at Retail Units Acquired at Cost 620 units@ $45 per unit 310 units @ $42 per unit 120 units @ $30 per unit Date Activities Jan. 1 Beginning inventory Feb. 10 Purchase Mar. 13 Purchase Mar. 15 Sales Aug. 21 Purchase Sept. 5 Purchase Sept. 10 Sales Totals 770 units@ $85 per unit 190 units @ $50 per unit 520 units...
 Montoure Company uses a perpetual inventory system. It entered
into the following calendar-year purchases and sales
transactions
Date
Activities
Units Acquired at Cost
Units Sold at Retail
Jan.
1
Beginning inventory
620
units
@ $45 per unit
Feb.
10
Purchase
310
units
@ $42 per unit
Mar.
13
Purchase
120
units
@ $30 per unit
Mar.
15
Sales
770
units
@ $85 per unit
Aug.
21
Purchase
190
units
@ $50 per unit
Sept.
5
Purchase
520
units
@ $48...
Montoure Company uses a perpetual inventory system. It entered
into the following calendar-year purchases and sales
transactions
Date
Activities
Units Acquired at Cost
Units Sold at Retail
Jan.
1
Beginning inventory
620
units
@ $45 per unit
Feb.
10
Purchase
310
units
@ $42 per unit
Mar.
13
Purchase
120
units
@ $30 per unit
Mar.
15
Sales
770
units
@ $85 per unit
Aug.
21
Purchase
190
units
@ $50 per unit
Sept.
5
Purchase
520
units
@ $48...
 Montoure Company uses a perpetual Inventory system. It entered into the following calendar year purchases and sales transactions. Units Sold at Retail Units Acquired at Cost 600 units $45 per unit 400 units $42 per unit 200 units $27 per unit Date Activities Jan. 1 Beginning inventory Feb. 10 Purchase Mar. 13 Purchase Mar. 15 Sales Aug. 21 Purchase Sept. 5 Purchase Sept. 10 Sales Totals 800 units $75 per unit 100 units $50 per unit 500 units @ $46...
 Montoure Company uses a perpetual Inventory system. It entered into the following calendar-year purchases and sales transactions Units sold at Retail Unite Aequired at Cost 680 units 540 per unit 320 units @ $35 per unit 100 units $23 per unit Date Activities Jan. Beginning inventory Feb. 10 Purchase Mar. 13 Purchase Mar. 15 Sales Aug. 21 Purchase Sept. 5 Purchase Sept. 10 Sales Totals 720 unitse $75 per unit 130 units 490 units $45 per unit $41 per unit...
 Montoure Company uses a perpetual inventory system. It entered
into the following calendar-year purchases and sales
transactions
Date
Activities
Units Acquired at Cost
Units Sold at Retail
Jan.
1
Beginning inventory
600
units
@ $35 per unit
Feb.
10
Purchase
300
units
@ $32 per unit
Mar.
13
Purchase
150
units
@ $20 per unit
Mar.
15
Sales
725
units
@ $80 per unit
Aug.
21
Purchase
190
units
@ $40 per unit
Sept.
5
Purchase
540
units
@ $37...
Montoure Company uses a perpetual inventory system. It entered
into the following calendar-year purchases and sales
transactions
Date
Activities
Units Acquired at Cost
Units Sold at Retail
Jan.
1
Beginning inventory
600
units
@ $35 per unit
Feb.
10
Purchase
300
units
@ $32 per unit
Mar.
13
Purchase
150
units
@ $20 per unit
Mar.
15
Sales
725
units
@ $80 per unit
Aug.
21
Purchase
190
units
@ $40 per unit
Sept.
5
Purchase
540
units
@ $37...
Most questions answered within 3 hours.
-
4. Without doing any calculations, predict whether the observed
∆T would increase, decrease or remain the...
asked 54 minutes ago -
Based on the range, which of the following sets of scores has
the greatest variability? 3,...
asked 2 hours ago -
Ripples in a pond travel at a velocity of 3 m/s with one peak
passing a...
asked 1 hour ago -
A man stands on the roof of a building of height 13.0 mm and
throws a...
asked 1 hour ago -
The extent to which assets are financed by borrowed funds and
other liabilities is indicated by:...
asked 2 hours ago -
Explain in detail
Germany is the fifth largest economy
explain what goods and services Germany specializes...
asked 3 hours ago -
The density of platinum is 21.45 g/mL. If a cube of platinum
with a mass of...
asked 3 hours ago -
Accounts Receivable
Sales
A/R Posting
Extended Sales Invoice
Packing Slip
Compare invoice to packing slip 2...
asked 3 hours ago -
Michaella, age 23, is a full-time law student and is claimed by
her parents as a...
asked 3 hours ago -
Why are polymers not typically casted into products?
asked 3 hours ago -
When rolling a die 129 times, what is the probability of rolling
a 6 no more...
asked 3 hours ago -
4. A call option currently sells for $7.75. It has a strike
price of $85 and...
asked 3 hours ago