Vertical Analysis for Income Statement For 20Y6, Fishing Experiences Inc. initiated a sales promotion campaign that...
Vertical Analysis for Income Statement
For 20Y6, Fishing Experiences Inc. initiated a sales promotion campaign that included the expenditure of an additional $19,000 for advertising. At the end of the year, Colt Schultz, the president, is presented with the following condensed comparative income statement:
| FISHING EXPERIENCES INC. Comparative Income Statement For the Years Ended December 31, 20Y6 and 20Y5 |
|||
| 20Y6 | 20Y5 | ||
| Sales | $695,000 | $598,000 | |
| Cost of goods sold | (326,650) | (328,900) | |
| Gross profit | $ 368,350 | $ 269,100 | |
| Selling expenses | (152,900) | (119,600) | |
| Administrative expenses | (62,550) | (77,740) | |
| Total operating expenses | $ (215,450) | $ (197,340) | |
| Operating income | $ 152,900 | $ 71,760 | |
| Other revenue | 41,700 | 23,920 | |
| Income before income tax | $ 194,600 | $ 95,680 | |
| Income tax expense | (76,450) | (35,880) | |
| Net income | $ 118,150 | $ 59,800 | |
Instructions:
1. Prepare a comparative income statement for the two-year period, presenting a vertical analysis of each item in relationship to sales for each of the years.
| Fishing Experiences Inc. | ||||
| Comparative Income Statement | ||||
| For the Years Ended December 31, 20Y6 and 20Y5 | ||||
| 20Y6 Amount | 20Y6 Percent | 20Y5 Amount | 20Y5 Percent | |
| Sales | $695,000 | % | $598,000 | % |
| Cost of goods sold | (326,650) | % | (328,900) | % |
| Gross profit | $368,350 | % | $269,100 | % |
| Selling expenses | $(152,900) | % | $(119,600) | % |
| Administrative expenses | (62,550) | % | (77,740) | % |
| Total operating expenses | $(215,450) | % | $(197,340) | % |
| Operating income | $152,900 | % | $71,760 | % |
| Other revenue | 41,700 | % | 23,920 | % |
| Income before income tax | $194,600 | % | $95,680 | % |
| Income tax expense | (76,450) | % | (35,880) | % |
| Net income | $118,150 | % | $59,800 | % |
2. Based on the vertical analysis prepared in 1
which of the following statements is correct?
a. Costs other than selling expenses (cost of goods sold and
administrative expenses) improved as a percentage of sales.
b. Net income as a percentage of sales increased.
c. The sales promotion campaign appears to have been
successful.
d. Selling expenses as a percent of sales increased slightly
Homework Answers
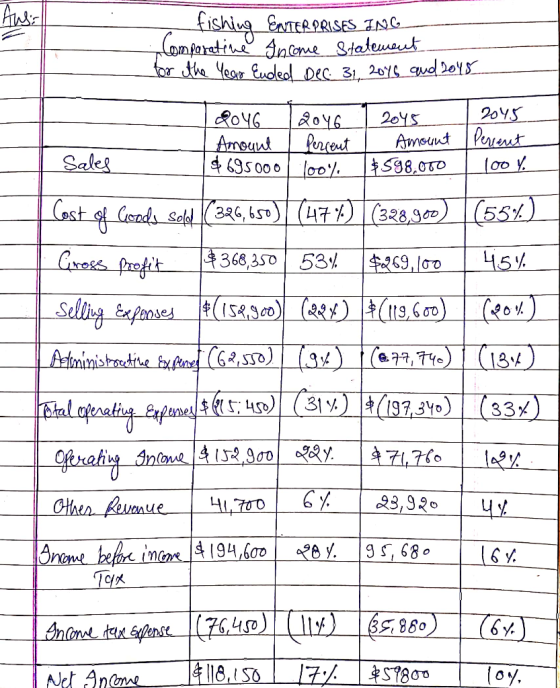
2. Net income as a percentage of sales increased.
If you have any query ask in comment section. If you like the answer plz rate. Thanks
Add Answer to:
Vertical Analysis for Income Statement
For 20Y6, Fishing Experiences Inc. initiated a sales promotion
campaign that...
Instructions: 1. Prepare a comparative income statement for the two-year period, presenting a vertical analysis of...
 Instructions: 1. Prepare a comparative income statement for the two-year period, presenting a vertical analysis of each item in relationship to sales for each of the years Fishing Experiences Inc. Comparative Income Statement For the Years Ended December 31, 20Y6 and 2OYS 20Y6 Amount 20Y6 Percent 20Y5 Amount 20Y5 Percent Sales Cost of goods sold Gross profit Selling expenses Administrative expenses Total operating expenses Operating income Other revenue Income before income tax Income tax expense Net income $734,000 (330,300) $403,700...
Vertical Analysis of Income Statement For 20Y2, Tri-Comic Company initiated a sales promotion campaign that included...
 Vertical Analysis of Income Statement For 20Y2, Tri-Comic Company initiated a sales promotion campaign that included the expenditure of an additional $21,000 for advertising. At the end of the year, Lumi Neer, the president, is presented with the following condensed comparative income statement: Tri-Comic Company Comparative Income Statement For the Years Ended December 31, 20Y2 and 2041 20Y2 20Y1 $746,000 $642,000 Sales Cost of goods sold Gross profit 350,620 333,840 $395,380 $308,160 Selling expenses $156,660 $128,400 82,060 83,460 Administrative expenses...
Vertical Analysis of Income Statement For 20Y2, Tri-Comic Company initiated a sales promotion campaign that included...
Vertical Analysis of Income Statement For 20Y2, Tri-Comic Company initiated a sales promotion campaign that included the expenditure of an additional $19,000 for advertising. At the end of the year, Lumi Neer, the president, is presented with the following condensed comparative income statement: Tri-Comic Company Comparative Income Statement For the Years Ended December 31, 20Y2 and 20Y1 20Y2 20Y1 Sales $680,000 $585,000 Cost of goods sold 326,400 310,050 Gross profit $353,600 $274,950 Selling expenses $129,200 $105,300 Administrative expenses 68,000 70,200...
Vertical analysis of income statement Instructions Income Statement Final Question Instructions For 20Y2, Tri-Comic Company initiated...
 Vertical analysis of income statement Instructions Income Statement Final Question Instructions For 20Y2, Tri-Comic Company initiated a sales promotion campaign that included the expenditure of an additional $50,000 for advertising. At the end of the year, Lumi Neer, the president, is presented with the following condensed comparative income statement: Tri-Comic Company Comparative Income Statement For the Years Ended December 31, 2042 and 2041 2092 2011 Sales $850,000.00 $500,000.00 Cost of goods sold 340,000.00 Gross profit $510,000.00 210,000.00 $290,000.00 $90,000.00 35,000.00...
Vertical Analysis of Income Statement Revenue and expense data for Innovation Quarter Inc. for two recent...
 Vertical Analysis of Income Statement
Revenue and expense data for Innovation Quarter Inc. for two
recent years are as follows:
Vertical Analysis of Income Statement Revenue and expense data for Innovation Quarter Inc. for two recent years are as follows: Current Year Previous Year Sales Cost of goods sold Selling expenses Administrative expenses Income tax expense a. Prepare an income statement in comparative form, stating each item for both years as a percent of sales. If required, round percentages to...
Vertical Analysis of Income Statement
Revenue and expense data for Innovation Quarter Inc. for two
recent years are as follows:
Vertical Analysis of Income Statement Revenue and expense data for Innovation Quarter Inc. for two recent years are as follows: Current Year Previous Year Sales Cost of goods sold Selling expenses Administrative expenses Income tax expense a. Prepare an income statement in comparative form, stating each item for both years as a percent of sales. If required, round percentages to...
Vertical Analysis of Income Statement Revenue and expense data for Innovation Quarter Inc. for two recent...
 Vertical Analysis of Income Statement Revenue and expense data for Innovation Quarter Inc. for two recent years are as follows: Current Previous Year Year $429,000 $378,000 270,270 211,680 64,350 68,040 Sales Cost of goods sold Selling expenses Administrative expenses Income tax expense 68,640 56,700 8,580 15,120 a. Prepare an income statement in comparative form, stating each item for both years as a percent of sales. If required, round percentages to one decimal place. Innovation Quarter Inc. Comparative Income Statement For...
Vertical Analysis of Income Statement Revenue and expense data for Innovation Quarter Inc. for two recent...
 Vertical Analysis of Income Statement Revenue and expense data for Innovation Quarter Inc. for two recent years are as follows: Current Year Previous Year Sales $404,000 $351,000 Cost of goods sold 254,520 203,580 Selling expenses 60,600 59,670 Administrative expenses 64,640 52,650 Income tax expense 8,080 14,040 a. Prepare an income statement in comparative form, stating each item for both years as a percent of sales. If required, round percentages to one decimal place. Enter all amounts as positive numbers. Innovation...
Vertical Analysis of Income Statement Revenue and expense data for Innovation Quarter Inc. for two recent...
Vertical Analysis of Income Statement Revenue and expense data for Innovation Quarter Inc. for two recent years are as follows: Current Year Previous Year Sales $543,000 $489,000 Cost of goods sold 298,650 244,500 Selling expenses 97,740 97,800 Administrative expenses 103,170 88,020 Income tax expense 16,290 24,450 a. Prepare an income statement in comparative form, stating each item for both years as a percent of sales. If required, round percentages to one decimal place. Enter all amounts as positive numbers. Innovation...
Vertical Analysis of Income Statement Revenue and expense data for Innovation Quarter Inc. for two recent...
 Vertical Analysis of Income Statement Revenue and expense data for Innovation Quarter Inc. for two recent years are as follows: Current Year Previous Year $551,000 $479,000 Sales Cost of goods sold 347,130 277,820 Selling expenses 82,650 Administrative expenses 88,160 81,430 71,850 19,160 Income tax expense 11,020 a. Prepare an income statement in comparative form, stating each item for both years as a percent of sales. If required, round percentages to one decimal place. Enter all amounts as positive numbers. Innovation...
Vertical Analysis of Income Statement Revenue and expense data for Innovation Quarter Inc. for two recent...
Vertical Analysis of Income Statement Revenue and expense data for Innovation Quarter Inc. for two recent years are as follows: Current Year Previous Year Sales $466,000 $424,000 Cost of goods sold 316,880 267,120 Selling expenses 60,580 63,600 Administrative expenses 65,240 55,120 Income tax expense 9,320 16,960 a. Prepare an income statement in comparative form, stating each item for both years as a percent of sales. If required, round percentages to one decimal place. Enter all amounts as positive numbers. Innovation...
 Instructions: 1. Prepare a comparative income statement for the two-year period, presenting a vertical analysis of each item in relationship to sales for each of the years Fishing Experiences Inc. Comparative Income Statement For the Years Ended December 31, 20Y6 and 2OYS 20Y6 Amount 20Y6 Percent 20Y5 Amount 20Y5 Percent Sales Cost of goods sold Gross profit Selling expenses Administrative expenses Total operating expenses Operating income Other revenue Income before income tax Income tax expense Net income $734,000 (330,300) $403,700...
 Vertical Analysis of Income Statement For 20Y2, Tri-Comic Company initiated a sales promotion campaign that included the expenditure of an additional $21,000 for advertising. At the end of the year, Lumi Neer, the president, is presented with the following condensed comparative income statement: Tri-Comic Company Comparative Income Statement For the Years Ended December 31, 20Y2 and 2041 20Y2 20Y1 $746,000 $642,000 Sales Cost of goods sold Gross profit 350,620 333,840 $395,380 $308,160 Selling expenses $156,660 $128,400 82,060 83,460 Administrative expenses...
 Vertical analysis of income statement Instructions Income Statement Final Question Instructions For 20Y2, Tri-Comic Company initiated a sales promotion campaign that included the expenditure of an additional $50,000 for advertising. At the end of the year, Lumi Neer, the president, is presented with the following condensed comparative income statement: Tri-Comic Company Comparative Income Statement For the Years Ended December 31, 2042 and 2041 2092 2011 Sales $850,000.00 $500,000.00 Cost of goods sold 340,000.00 Gross profit $510,000.00 210,000.00 $290,000.00 $90,000.00 35,000.00...
 Vertical Analysis of Income Statement
Revenue and expense data for Innovation Quarter Inc. for two
recent years are as follows:
Vertical Analysis of Income Statement Revenue and expense data for Innovation Quarter Inc. for two recent years are as follows: Current Year Previous Year Sales Cost of goods sold Selling expenses Administrative expenses Income tax expense a. Prepare an income statement in comparative form, stating each item for both years as a percent of sales. If required, round percentages to...
Vertical Analysis of Income Statement
Revenue and expense data for Innovation Quarter Inc. for two
recent years are as follows:
Vertical Analysis of Income Statement Revenue and expense data for Innovation Quarter Inc. for two recent years are as follows: Current Year Previous Year Sales Cost of goods sold Selling expenses Administrative expenses Income tax expense a. Prepare an income statement in comparative form, stating each item for both years as a percent of sales. If required, round percentages to...
 Vertical Analysis of Income Statement Revenue and expense data for Innovation Quarter Inc. for two recent years are as follows: Current Previous Year Year $429,000 $378,000 270,270 211,680 64,350 68,040 Sales Cost of goods sold Selling expenses Administrative expenses Income tax expense 68,640 56,700 8,580 15,120 a. Prepare an income statement in comparative form, stating each item for both years as a percent of sales. If required, round percentages to one decimal place. Innovation Quarter Inc. Comparative Income Statement For...
 Vertical Analysis of Income Statement Revenue and expense data for Innovation Quarter Inc. for two recent years are as follows: Current Year Previous Year Sales $404,000 $351,000 Cost of goods sold 254,520 203,580 Selling expenses 60,600 59,670 Administrative expenses 64,640 52,650 Income tax expense 8,080 14,040 a. Prepare an income statement in comparative form, stating each item for both years as a percent of sales. If required, round percentages to one decimal place. Enter all amounts as positive numbers. Innovation...
 Vertical Analysis of Income Statement Revenue and expense data for Innovation Quarter Inc. for two recent years are as follows: Current Year Previous Year $551,000 $479,000 Sales Cost of goods sold 347,130 277,820 Selling expenses 82,650 Administrative expenses 88,160 81,430 71,850 19,160 Income tax expense 11,020 a. Prepare an income statement in comparative form, stating each item for both years as a percent of sales. If required, round percentages to one decimal place. Enter all amounts as positive numbers. Innovation...
Most questions answered within 3 hours.
-
(63
#14)
which of the following statments best describes how chamging
the concentration of the substances...
asked 40 minutes ago -
In the following reaction, which element is undergoing
oxidation: Na2SO3 + N2O --> N2 + Na2SO4...
asked 1 hour ago -
Which of the following pairs of ions have the same electron
configuration?
I: Br− and Se2−...
asked 4 hours ago -
The Foremost Composite Materials Company is planning a two-day
sales conference for October 19-20. The conference...
asked 4 hours ago -
3) Illustrate the observed pattern of relatedness of organisms
versus adaptations to specific conditions. This means...
asked 4 hours ago -
In winter a lake has a 0.35 m thick ice layer over 1.10 m of
water....
asked 5 hours ago -
Assuming the following has been encrypted with a Vigenere cipher
below, use the method(s) and assumptions...
asked 6 hours ago -
How would I use switch statements to write a program that will
take an input of...
asked 5 hours ago -
Imagine a reaction in which methane gas combusts at a constant
pressure of 1 atm and...
asked 6 hours ago -
Two parallel wires (each 12 m in length) are separated by a
distance of 0.065 m...
asked 6 hours ago -
Suppose there were three masses at the corner of uniform
equilateral triangle. The masses are m1...
asked 6 hours ago -
Situation: A building that is 618 m above the ground floor. How
many times would a...
asked 6 hours ago