QUESTION 5 Consider the performance of two securities, J and K over the five year period...
QUESTION 5
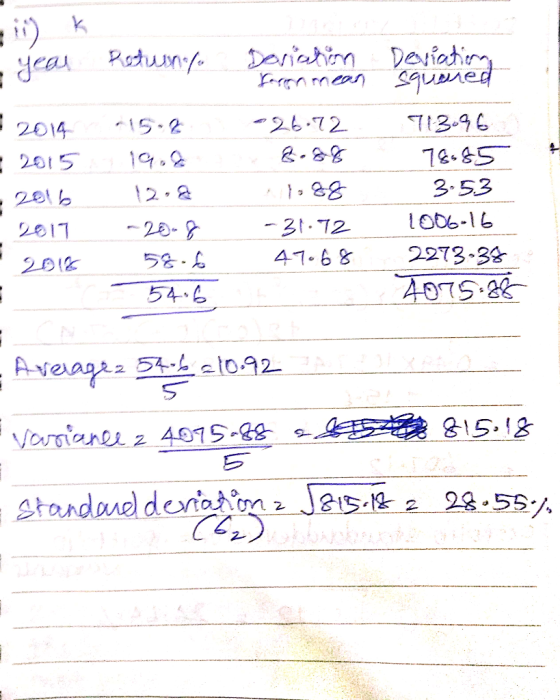
Consider the performance of two securities, J and K over the five year period from 2014 to 2018. The annual return earned on each one of them is as provided in the table below:
|
Year |
J |
K |
|
% |
% |
|
|
2014 |
37.9 |
-15.8 |
|
2015 |
28.4 |
19.8 |
|
2016 |
-0.1 |
12.8 |
|
2017 |
-50.0 |
-20.8 |
|
2018 |
31.7 |
58.6 |
Required:
Compute the following:
- Assume your organization had K150 million to invest on 01st January, 2014. If 70% was invested in security J over the holding period, the annual returns would you have earned from a portfolio comprising the two securities.
[05 Marks]
- The annual volatilities of the portfolio with the above investment proportions; assuming the correlation coefficient between returns on securities J and K remained constant at 0.04 over the holding period.
[10 Marks]
- Evaluate the performance of the portfolio for each year of the holding period and advise when the performance was satisfactory. Assume a risk-free rate of 6%.
[05 Marks]
Total 20 Marks
Homework Answers


Add Answer to:
QUESTION 5
Consider the performance of two securities, J and K over the
five year period...
QUESTIONS Consider the performance of two securities and k over the five year period from 2014...
 QUESTIONS Consider the performance of two securities and k over the five year period from 2014 to 2018. The annual return earned on each one of them is as provided in the table below Year 379 28.4 -15 a 2014 2015 2016 2017 2018 19.8 128 -208 58.6 -500 31.7 Required: Compute the following: a) Assume your organization had K150 million to invest on 01st January, 2014. If 70% was invested in security J over the holding period, the annual...
You have been given information about the performance of two securities, a Telecoms stock and a...
 You have been given information about the performance of two securities, a Telecoms stock and a Bank stock, over the past ten years in the table below. Based on this information, you have been requested to undertake a performance analysis with a view to forming a two-security portfolio. Year Telecoms Bank % % 2000 0.1 -4.5 2001 -16.1 42.7 2002 -28.3 14.5 2003 20.1 1.7 3.7 2004 21.5 2005 0.2 2.4 53.2 20.7 2006 2007 20.6 -18.9 2008 -28.0 -63.1...
17.30 Mini Case This Mini Case is available in MyFinanceLab. Note: Although not absolutely necessary, you...
 17.30 Mini Case This Mini Case is available in MyFinanceLab. Note: Although not absolutely necessary, you are advised to use a computer spread- sheet to work the following problem. a. Use the price data from the table that follows for the Standard & Poor's 500 Index, Wal-Mart, and Target to calculate the holding period returns for the 24 months from May 2013 through May 2015 MONT SEP 500 TAASET 2013 May $1,631 $74.84 $69.50 June 1,606 74.49 68.86 July 1,686...
CASE 1-5 Financial Statement Ratio Computation Refer to Campbell Soup Company's financial Campbell Soup statements in...
 CASE 1-5 Financial Statement Ratio Computation Refer to Campbell Soup Company's financial Campbell Soup statements in Appendix A. Required: Compute the following ratios for Year 11. Liquidity ratios: Asset utilization ratios:* a. Current ratio n. Cash turnover b. Acid-test ratio 0. Accounts receivable turnover c. Days to sell inventory p. Inventory turnover d. Collection period 4. Working capital turnover Capital structure and solvency ratios: 1. Fixed assets turnover e. Total debt to total equity s. Total assets turnover f. Long-term...
 QUESTIONS Consider the performance of two securities and k over the five year period from 2014 to 2018. The annual return earned on each one of them is as provided in the table below Year 379 28.4 -15 a 2014 2015 2016 2017 2018 19.8 128 -208 58.6 -500 31.7 Required: Compute the following: a) Assume your organization had K150 million to invest on 01st January, 2014. If 70% was invested in security J over the holding period, the annual...
 You have been given information about the performance of two securities, a Telecoms stock and a Bank stock, over the past ten years in the table below. Based on this information, you have been requested to undertake a performance analysis with a view to forming a two-security portfolio. Year Telecoms Bank % % 2000 0.1 -4.5 2001 -16.1 42.7 2002 -28.3 14.5 2003 20.1 1.7 3.7 2004 21.5 2005 0.2 2.4 53.2 20.7 2006 2007 20.6 -18.9 2008 -28.0 -63.1...
 17.30 Mini Case This Mini Case is available in MyFinanceLab. Note: Although not absolutely necessary, you are advised to use a computer spread- sheet to work the following problem. a. Use the price data from the table that follows for the Standard & Poor's 500 Index, Wal-Mart, and Target to calculate the holding period returns for the 24 months from May 2013 through May 2015 MONT SEP 500 TAASET 2013 May $1,631 $74.84 $69.50 June 1,606 74.49 68.86 July 1,686...
 CASE 1-5 Financial Statement Ratio Computation Refer to Campbell Soup Company's financial Campbell Soup statements in Appendix A. Required: Compute the following ratios for Year 11. Liquidity ratios: Asset utilization ratios:* a. Current ratio n. Cash turnover b. Acid-test ratio 0. Accounts receivable turnover c. Days to sell inventory p. Inventory turnover d. Collection period 4. Working capital turnover Capital structure and solvency ratios: 1. Fixed assets turnover e. Total debt to total equity s. Total assets turnover f. Long-term...
Most questions answered within 3 hours.
-
20% of all customers subscribe to phone service.
70% of all customers subscribe to internet service....
asked 2 minutes ago -
Write a program to solve the Josephus problem, with the following
modification:
Sample Input:
./a.out n...
asked 2 hours ago -
At the start of a CD it is spinning at a rate of 525 rpm
(revolutions...
asked 3 hours ago -
4. Without doing any calculations, predict whether the observed
∆T would increase, decrease or remain the...
asked 4 hours ago -
Based on the range, which of the following sets of scores has
the greatest variability? 3,...
asked 5 hours ago -
Ripples in a pond travel at a velocity of 3 m/s with one peak
passing a...
asked 5 hours ago -
A man stands on the roof of a building of height 13.0 mm and
throws a...
asked 5 hours ago -
The extent to which assets are financed by borrowed funds and
other liabilities is indicated by:...
asked 6 hours ago -
Explain in detail
Germany is the fifth largest economy
explain what goods and services Germany specializes...
asked 6 hours ago -
The density of platinum is 21.45 g/mL. If a cube of platinum
with a mass of...
asked 7 hours ago -
Accounts Receivable
Sales
A/R Posting
Extended Sales Invoice
Packing Slip
Compare invoice to packing slip 2...
asked 7 hours ago -
Michaella, age 23, is a full-time law student and is claimed by
her parents as a...
asked 7 hours ago