
Homework Answers
Ans) At equilibrium, quantity demanded is equal to quantity supplied. This is market clearing point. When price is above equilibrium price, there is surplus or excess supply in the market.
Price flooring is the legal maximum price that must be paid for the product. It decreases consumer surplus and increases producer surplus. It also creates deadweightloss.
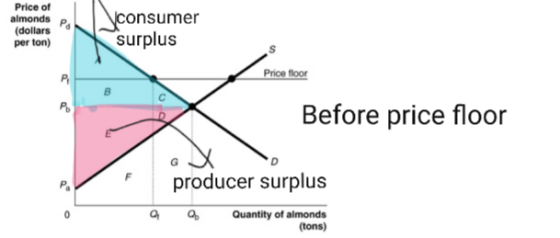

1) Area B represents area of consumer surplus that is transferred to producer surplus. Option a.
2) Ar C and D represent deadweightloss. Option d.
3) When government imposes tax, its effect is similar to shift in demand or supply curve and hence affects the market equilibrium.
Option d.
4) Price elasticity of demand is the responsiveness of quantity demanded to change in price.
Option c.
Add Answer to:
Price of almonds P (dollars per ton) Price floor Quantity of almonds (tons) Figure 4-6 shows...
Price of almonds (dollars per ton) S A Price floor P В C Р. E G...
 Price of almonds (dollars per ton) S A Price floor P В C Р. E G Quantity of almonds (tons) Figure 4-6 shows the demand and supply curves for the almond market. The government believes that the equilibrium pr is too low and tries to help almond growers by setting a price floor at P 5) Refer to Figure 4-6. What area represents the portion of consumer surplus that has been transferred to producer surplus as a result of the...
Figure 4-5 Price (dollars per month $2,500 2.000 Demand 0 200400 800 Quantity (apartments) Figure 4-5...
 Figure 4-5 Price (dollars per month $2,500 2.000 Demand 0 200400 800 Quantity (apartments) Figure 4-5 shows the market for apartments in Springfield. Recently, the government imposed a rent ceiling of $1.000 per month. 2) 2) Refer to Figure 4-5. Suppose that instead of a rent ceiling, the government imposed a price floor of 12,000 per month for apartments. What is the quantity of apartments demanded at the new price? B) 200 C) 300 D) 500 A) 3) Refer to...
Price $5.00 - 2.00 25 45 60 75 Quantity Refer to Figure 6-7. If the government...
 Price $5.00 - 2.00 25 45 60 75 Quantity Refer to Figure 6-7. If the government imposes a binding price floor of $5.00 in this market, what is the result? a surplus of 15 units a surplus of 20 units a surplus of 35 units a shortage of 20 units Figure 8-5 Price Quantity Refer to Figure 8-5. Assume the tax was levied on the consumer. Which area represents the reduction in producer surplus? ОА Ов+с OD+E+F ODE
Figure 4-10 Figure 4-10 shows the market for apartments in Bay City. Recently, the government imposed...
 Figure 4-10 Figure 4-10 shows the market for apartments in Bay City. Recently, the government imposed a rent ceiling at RO. 1) Refer to Figure 4-10. What is the area that represents the portion of producer surplus transferred to consumers as a result of the rent ceiling? A) D+E B) D+F CD DF 2) Refer to Figure 4-10. What area represents the deadweight loss after the imposition of the ceiling? A) G+ H B ) J+ H C ) C...
QUESTION 3 Figure Price Supply P K I P" P B M N Demand Quantity Refer...
 QUESTION 3 Figure Price Supply P K I P" P B M N Demand Quantity Refer to Figure. If the government imposes a tax size of P- P" in the above market then the area L+M+Y represents a. consumer surplus after the tax. producer surplus after the tax. Cconsumer surplus before the tax. producer surplus before the tax. QUESTION 4 4 point Figure Supply Dennd Quantity Q1 02 Q3 Q Qs Refer to Figure. If the government impose a tax...
Figure 4-6 Price Supply Ront coling o, a* 0 Quantity of- Figure 4-6 shows the market...
 Figure 4-6 Price Supply Ront coling o, a* 0 Quantity of- Figure 4-6 shows the market for apartments in Bay City. Recently, the government imposed a rent ceiling at Ro 12 Refer to Figure 4-6. What is the area that represents consumer surplus after the imposition of the ceiling? THERE ARE OTHER QUESTIONS ON THE TEST THAT REFER TO THIS SAME GRAPH. SCROLL TO FIND THE QUESTIONS WITH THIS SAME GRAPH AND WORK ON THEM TOGETHER. 15 n 2 Saved...
2. If we place a price floor of $30 do we have a surplus or shortage?...
 2. If we place a price floor of $30 do we have a surplus or shortage? By how much? Label producer surplus, consumer surplus, and dead weight loss. What is the quantity sold? Calculate the area of consumer surplus, producer surplus, and dead weight loss. $60 $40 $20 20 40 60 0
3) Refer to Figure 9.3.1. If the government establishes a price floor of $40 and government...
3) Refer to Figure 9.3.1. If the government establishes a price floor of $40 and government purchases the surplus over quantity demanded, producer surplus will: A) fall by $275. B) fall by $500. C) remain the same. D) rise by $275. E) rise by $500. Answer: E Please Explain Step by Step. Thanks!
1. 2. 3. 4. 5. 6. Submit when finished answering the R button. Due to this being a web course, only scores will...
 1.
2.
3.
4.
5.
6.
Submit when finished answering the R button. Due to this being a web course, only scores will be shown, there will be back Question 1 1 pts Willingness to pay measures the value that a buyer places on a good. O is the amount a seller actually receives for a good minus the minimum amount the seller is willing to accept. is the maximum amount a buyer is willing to pay minus the minimum...
1.
2.
3.
4.
5.
6.
Submit when finished answering the R button. Due to this being a web course, only scores will be shown, there will be back Question 1 1 pts Willingness to pay measures the value that a buyer places on a good. O is the amount a seller actually receives for a good minus the minimum amount the seller is willing to accept. is the maximum amount a buyer is willing to pay minus the minimum...
suppose that Figure 6-3 Panel (a) Panel (b) lo IP 10 IM Price Floor Price Ceiling...
 suppose that
Figure 6-3 Panel (a) Panel (b) lo IP 10 IM Price Floor Price Ceiling 2 4 6 8 10 12 14 16 Quantity -+ 4 + 6 + 8 + + + 10 12 14 16 Duality 3. Refer to Figure 6-3. A binding price floor is shown in a. both panel (a) and panel (b). b. panel (a) only. c. panel (b) only. d. neither panel (a) nor panel (b). ght Congage Leaming. Powered by Cognero. >...
suppose that
Figure 6-3 Panel (a) Panel (b) lo IP 10 IM Price Floor Price Ceiling 2 4 6 8 10 12 14 16 Quantity -+ 4 + 6 + 8 + + + 10 12 14 16 Duality 3. Refer to Figure 6-3. A binding price floor is shown in a. both panel (a) and panel (b). b. panel (a) only. c. panel (b) only. d. neither panel (a) nor panel (b). ght Congage Leaming. Powered by Cognero. >...
 Price of almonds (dollars per ton) S A Price floor P В C Р. E G Quantity of almonds (tons) Figure 4-6 shows the demand and supply curves for the almond market. The government believes that the equilibrium pr is too low and tries to help almond growers by setting a price floor at P 5) Refer to Figure 4-6. What area represents the portion of consumer surplus that has been transferred to producer surplus as a result of the...
 Figure 4-5 Price (dollars per month $2,500 2.000 Demand 0 200400 800 Quantity (apartments) Figure 4-5 shows the market for apartments in Springfield. Recently, the government imposed a rent ceiling of $1.000 per month. 2) 2) Refer to Figure 4-5. Suppose that instead of a rent ceiling, the government imposed a price floor of 12,000 per month for apartments. What is the quantity of apartments demanded at the new price? B) 200 C) 300 D) 500 A) 3) Refer to...
 Price $5.00 - 2.00 25 45 60 75 Quantity Refer to Figure 6-7. If the government imposes a binding price floor of $5.00 in this market, what is the result? a surplus of 15 units a surplus of 20 units a surplus of 35 units a shortage of 20 units Figure 8-5 Price Quantity Refer to Figure 8-5. Assume the tax was levied on the consumer. Which area represents the reduction in producer surplus? ОА Ов+с OD+E+F ODE
 Figure 4-10 Figure 4-10 shows the market for apartments in Bay City. Recently, the government imposed a rent ceiling at RO. 1) Refer to Figure 4-10. What is the area that represents the portion of producer surplus transferred to consumers as a result of the rent ceiling? A) D+E B) D+F CD DF 2) Refer to Figure 4-10. What area represents the deadweight loss after the imposition of the ceiling? A) G+ H B ) J+ H C ) C...
 QUESTION 3 Figure Price Supply P K I P" P B M N Demand Quantity Refer to Figure. If the government imposes a tax size of P- P" in the above market then the area L+M+Y represents a. consumer surplus after the tax. producer surplus after the tax. Cconsumer surplus before the tax. producer surplus before the tax. QUESTION 4 4 point Figure Supply Dennd Quantity Q1 02 Q3 Q Qs Refer to Figure. If the government impose a tax...
 Figure 4-6 Price Supply Ront coling o, a* 0 Quantity of- Figure 4-6 shows the market for apartments in Bay City. Recently, the government imposed a rent ceiling at Ro 12 Refer to Figure 4-6. What is the area that represents consumer surplus after the imposition of the ceiling? THERE ARE OTHER QUESTIONS ON THE TEST THAT REFER TO THIS SAME GRAPH. SCROLL TO FIND THE QUESTIONS WITH THIS SAME GRAPH AND WORK ON THEM TOGETHER. 15 n 2 Saved...
 2. If we place a price floor of $30 do we have a surplus or shortage? By how much? Label producer surplus, consumer surplus, and dead weight loss. What is the quantity sold? Calculate the area of consumer surplus, producer surplus, and dead weight loss. $60 $40 $20 20 40 60 0
 1.
2.
3.
4.
5.
6.
Submit when finished answering the R button. Due to this being a web course, only scores will be shown, there will be back Question 1 1 pts Willingness to pay measures the value that a buyer places on a good. O is the amount a seller actually receives for a good minus the minimum amount the seller is willing to accept. is the maximum amount a buyer is willing to pay minus the minimum...
1.
2.
3.
4.
5.
6.
Submit when finished answering the R button. Due to this being a web course, only scores will be shown, there will be back Question 1 1 pts Willingness to pay measures the value that a buyer places on a good. O is the amount a seller actually receives for a good minus the minimum amount the seller is willing to accept. is the maximum amount a buyer is willing to pay minus the minimum...
 suppose that
Figure 6-3 Panel (a) Panel (b) lo IP 10 IM Price Floor Price Ceiling 2 4 6 8 10 12 14 16 Quantity -+ 4 + 6 + 8 + + + 10 12 14 16 Duality 3. Refer to Figure 6-3. A binding price floor is shown in a. both panel (a) and panel (b). b. panel (a) only. c. panel (b) only. d. neither panel (a) nor panel (b). ght Congage Leaming. Powered by Cognero. >...
suppose that
Figure 6-3 Panel (a) Panel (b) lo IP 10 IM Price Floor Price Ceiling 2 4 6 8 10 12 14 16 Quantity -+ 4 + 6 + 8 + + + 10 12 14 16 Duality 3. Refer to Figure 6-3. A binding price floor is shown in a. both panel (a) and panel (b). b. panel (a) only. c. panel (b) only. d. neither panel (a) nor panel (b). ght Congage Leaming. Powered by Cognero. >...
Most questions answered within 3 hours.
-
The factory method and the abstract factory pattern use
different object oriented
mechanisms are used to...
asked 2 hours ago -
Given the data below for the monthly sales data at each branch in
your region for...
asked 3 hours ago -
Blossom Company owns 10000 of the 50000 outstanding shares of
Taylor, Inc. common stock. During 2018,...
asked 4 hours ago -
Calculate the following: ***SHOW ALL WORK!!!! Or
NO CREDIT*** Circle your answers. 8pts
each
In the...
asked 6 hours ago -
Bank Z is currently advertising interest rates on its checking
account. They claim to pay an...
asked 5 hours ago -
List two ways of transformation on the response variable that
can be used to deal with...
asked 6 hours ago -
If a 2000 ohm resistor has a -3.90 mA current going through it.
What is the...
asked 6 hours ago -
Please comment on the sentences.
Some types of jobs require more training than others. Some
companies...
asked 7 hours ago -
The )G01 for the hydrolysis of phosphorarginine
reaction depicted below is –32 kJ mol-1.
Phosphoarginine ...
asked 8 hours ago -
Cross a heterozygous blue-eyed goat with a homozygous brown-eyed
goat. Be sure to indicate which kids...
asked 8 hours ago -
Use the following information to answer the next two
questions.
Please refer to question 9-90. A...
asked 8 hours ago -
A solution containing 0.050 g of an unknown electrolyte in 2.50
g of cyclohexane was found...
asked 9 hours ago