
Homework Answers
(a)
Following table shows the calculations:

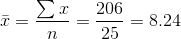
Sample size: n=25
Now,
Mean:
The variance:

Standard deviation:

(b)
Following is the ordered data set:

First interval:

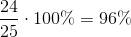
Out of 25 data values, 18 lies in the above interval so the required percentage is

Second interval:

Out of 25 data values, 24 lies in the above interval so the required percentage is
Third interval:

Out of 25 data values, 25 lies in the above interval so the required percentage is

(c)
According to empirical rule 68% data values lies within one standard deviation of mean, 95% data values lies within two standard deviations of mean and 99.7% data values lies within three standard deviations of mean.
All the percentages of part b are greater than percentages given by empirical rule.
------------
Chebyshev's rule:
According to Chebyshev's rule at least 0% data values lies within one standard deviation of mean, at least 75% data values lies within two standard deviations of mean and at least 88.9% data values lies within three standard deviations of mean.
All the percentages of part b are as specified by part c.
(d)
The range is
Range = Maximum - Minimum = 12 - 5 = 7
According to range rule the standard deviation is approximately equal to one fourth of the range of the data so

The standard deviation found in part (a) is greater than the above estimated standard deviation.
Add Answer to:
28 The following is a sample of 25 measurements. L02098 7 6 6 11 8 9...
Saved 2023 A sample of 100 bank customer waiting times are given in the following table:...
 Saved 2023 A sample of 100 bank customer waiting times are given in the following table: Waiting Times (in Minutes) for the Bank Custoner Waiting Tine Case 4.5 9.7 11.8 10.4 4.2 7.e 5.5 8.7 8.8 5.1 5.4 4.5 6.2 3.9 8.7 7.6 4.7 4.0 4.0 10.1 .3 2.8 5.4 6.5 9.7 5.2 7.0 5.8 4.5 8.2 1.9 5.2 4.1 7.9 5.3 8.8 6.2 4.1 4.1 4.5 10.4 .2 7.0 6.8 5.5 8.3 11.3 5.9 8.8 2.8 6.7 5.5 5.e...
Example (H.W): You have the following data: 8 6 11 14 10 11 9 7 2...
Example (H.W): You have the following data: 8 6 11 14 10 11 9 7 2 8 9 5 5 5 12 7 8 4 17 8 12 7 8 8 7 10 8 6 9 9 11 16 2 7 4 8 4 4 5 5 9 9 6 6 7 7 9 5 4 5 14 2 9 0 6 1 1 12 11 4 1. Construct a frequency distribution for these data. 2. Develop a relative frequency...
I need help with Part e. I have already constructed the histogram using R and Rstudio (picture below). I am just confused about the empirical rule and locating the data points on the intervals. If a...
 I need help with Part e. I have already constructed the
histogram using R and Rstudio (picture below). I am just confused
about the empirical rule and locating the data points on the
intervals. If anyone could assist me, I'd appreciate it greatly!
Thank you!
e radon concentration (in pCi/liter) data obtained from 40 houses in a 1.5.10. Th certain area are given below. 2.9 0.6 13.5 17.1 2.8 3.8 16.0 2.1 6.4 17.2 7.9 0.5 13.7 115 2.9 3.6...
I need help with Part e. I have already constructed the
histogram using R and Rstudio (picture below). I am just confused
about the empirical rule and locating the data points on the
intervals. If anyone could assist me, I'd appreciate it greatly!
Thank you!
e radon concentration (in pCi/liter) data obtained from 40 houses in a 1.5.10. Th certain area are given below. 2.9 0.6 13.5 17.1 2.8 3.8 16.0 2.1 6.4 17.2 7.9 0.5 13.7 115 2.9 3.6...
(6 pts) Suppose you have selected a random sample of n 7 measurements from a normal...
 (6 pts) Suppose you have selected a random sample of n 7 measurements from a normal distribution. Compare the standard normal z values with the corresponding t values if you were forming the following confidence intervals. (a) 80% confidence interval (b) 90% confidence interval (c) 95% confidence interval
Q1. A sample of n = 8 scores has a mean of M = 7. One...
Q1. A sample of n = 8 scores has a mean of M = 7. One score in the sample is changed from X = 20 to X = 4. What is the value for the new sample mean? Q2. A sample yielded the following scores: 2, 3, 4, 4, 5, 5, 5, 6, 6, 7 Assume that the scores are measurements of a discrete variable and find the median. Median = Assume that the scores are measurements of a...
Questions 7-12: Find the inverse Laplace transform of the following. 1) F(s) = s+7 e +2)e(s+8)...
 Questions 7-12: Find the inverse Laplace transform of the following. 1) F(s) = s+7 e +2)e(s+8) 10.) F(s)+2 s2 +3s +6 2s + 22 8.) F(s)--s428- 11.) Fo) 4s+13 12s +108s2 +552s +1008 +12s +107s +426s+754 34s2 +119s+71 12.) F(s)
6. The following stem-and-leaf diagram gives the number of patents held by each of a sample...
 6. The following stem-and-leaf diagram gives the number of
patents held by each of a sample of 36 public and private U.S.
universities.
A- I
6. The following stem-and-leaf diagram gives the number of patents held by each of a sample of 36 public and private U.S. universities. 0 223 4799 1 11145566689 2 023479 3 004355 419 a) What is the shape of the distribution? Explain. b) What percentage of universities in the sample hold at least 50 patents?...
6. The following stem-and-leaf diagram gives the number of
patents held by each of a sample of 36 public and private U.S.
universities.
A- I
6. The following stem-and-leaf diagram gives the number of patents held by each of a sample of 36 public and private U.S. universities. 0 223 4799 1 11145566689 2 023479 3 004355 419 a) What is the shape of the distribution? Explain. b) What percentage of universities in the sample hold at least 50 patents?...
Question 11 6 pts Consider the following sample values: 1, 4, 5, 6, 6, 7, 8,...
 Question 11 6 pts Consider the following sample values: 1, 4, 5, 6, 6, 7, 8, 10, 11, 12 What is the sample standard deviation? 1.06 3.37 None of the others. 11.33
1. 2. 3. 4. 5. 6. 7. 8. 9. 10. A Data Generating Process (or population)...
 1.
2.
3.
4.
5.
6.
7.
8.
9.
10.
A Data Generating Process (or population) is? (a) The sample b) The distribution that generates the data (c) The distribution of the sample mean (d) The empirical distribution of the data
1.
2.
3.
4.
5.
6.
7.
8.
9.
10.
A Data Generating Process (or population) is? (a) The sample b) The distribution that generates the data (c) The distribution of the sample mean (d) The empirical distribution of the data
 Saved 2023 A sample of 100 bank customer waiting times are given in the following table: Waiting Times (in Minutes) for the Bank Custoner Waiting Tine Case 4.5 9.7 11.8 10.4 4.2 7.e 5.5 8.7 8.8 5.1 5.4 4.5 6.2 3.9 8.7 7.6 4.7 4.0 4.0 10.1 .3 2.8 5.4 6.5 9.7 5.2 7.0 5.8 4.5 8.2 1.9 5.2 4.1 7.9 5.3 8.8 6.2 4.1 4.1 4.5 10.4 .2 7.0 6.8 5.5 8.3 11.3 5.9 8.8 2.8 6.7 5.5 5.e...
 I need help with Part e. I have already constructed the
histogram using R and Rstudio (picture below). I am just confused
about the empirical rule and locating the data points on the
intervals. If anyone could assist me, I'd appreciate it greatly!
Thank you!
e radon concentration (in pCi/liter) data obtained from 40 houses in a 1.5.10. Th certain area are given below. 2.9 0.6 13.5 17.1 2.8 3.8 16.0 2.1 6.4 17.2 7.9 0.5 13.7 115 2.9 3.6...
I need help with Part e. I have already constructed the
histogram using R and Rstudio (picture below). I am just confused
about the empirical rule and locating the data points on the
intervals. If anyone could assist me, I'd appreciate it greatly!
Thank you!
e radon concentration (in pCi/liter) data obtained from 40 houses in a 1.5.10. Th certain area are given below. 2.9 0.6 13.5 17.1 2.8 3.8 16.0 2.1 6.4 17.2 7.9 0.5 13.7 115 2.9 3.6...
 (6 pts) Suppose you have selected a random sample of n 7 measurements from a normal distribution. Compare the standard normal z values with the corresponding t values if you were forming the following confidence intervals. (a) 80% confidence interval (b) 90% confidence interval (c) 95% confidence interval
 Questions 7-12: Find the inverse Laplace transform of the following. 1) F(s) = s+7 e +2)e(s+8) 10.) F(s)+2 s2 +3s +6 2s + 22 8.) F(s)--s428- 11.) Fo) 4s+13 12s +108s2 +552s +1008 +12s +107s +426s+754 34s2 +119s+71 12.) F(s)
 6. The following stem-and-leaf diagram gives the number of
patents held by each of a sample of 36 public and private U.S.
universities.
A- I
6. The following stem-and-leaf diagram gives the number of patents held by each of a sample of 36 public and private U.S. universities. 0 223 4799 1 11145566689 2 023479 3 004355 419 a) What is the shape of the distribution? Explain. b) What percentage of universities in the sample hold at least 50 patents?...
6. The following stem-and-leaf diagram gives the number of
patents held by each of a sample of 36 public and private U.S.
universities.
A- I
6. The following stem-and-leaf diagram gives the number of patents held by each of a sample of 36 public and private U.S. universities. 0 223 4799 1 11145566689 2 023479 3 004355 419 a) What is the shape of the distribution? Explain. b) What percentage of universities in the sample hold at least 50 patents?...
 Question 11 6 pts Consider the following sample values: 1, 4, 5, 6, 6, 7, 8, 10, 11, 12 What is the sample standard deviation? 1.06 3.37 None of the others. 11.33
 1.
2.
3.
4.
5.
6.
7.
8.
9.
10.
A Data Generating Process (or population) is? (a) The sample b) The distribution that generates the data (c) The distribution of the sample mean (d) The empirical distribution of the data
1.
2.
3.
4.
5.
6.
7.
8.
9.
10.
A Data Generating Process (or population) is? (a) The sample b) The distribution that generates the data (c) The distribution of the sample mean (d) The empirical distribution of the data
Most questions answered within 3 hours.
-
Write a recursive function moreFactors(a,b,fact) that does the
following:
1. Takes as an input 3 positive...
asked 2 minutes ago -
In 2005, Derrek Lee led the National Baseball League with a
0.335 batting average, meaning that...
asked 3 minutes ago -
In order for corporations to behave ethically, they must,
ultimately, give up the profit motive.
...
asked 3 minutes ago -
Blue Spruce Corp. owns equipment that cost $63,400 when
purchased on January 1, 2017. It has...
asked 23 minutes ago -
A lottery exists where balls numbered 1 to 17 are placed in an
urn. To win,...
asked 1 hour ago -
Please explain steps:
An 80 kg swimmer steps off a platform 10 m above the water...
asked 1 hour ago -
26) Briefly describe, using words or simple diagrams, the
chemiosmotic theory for coupling oxidation to phosphorylation...
asked 3 hours ago -
Suppose that XX is a random variable with mean 16 and standard
deviation 5 . Also...
asked 4 hours ago -
Calculate the number density of argon gas at a temperature of
24C and a pressure of...
asked 7 hours ago -
Alternative
Classification
How to Estimate
Probabilities from Data? ( For continuous Attributes)
And How to generate...
asked 7 hours ago -
An explosion breaks a 20.0-kg object into three parts. The
object is initially moving at a...
asked 8 hours ago -
Calculate the approximate number of residues of Rubisco, which
is involved in carbon fixation in plants,...
asked 9 hours ago