
Homework Answers
i) The image of this answer is attached here.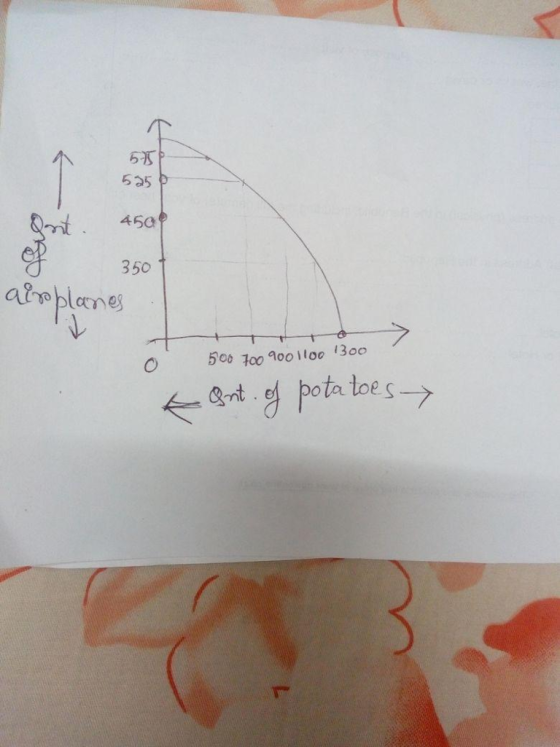
ii) The opportunity cost per unit of expanding the production from 450 units of aeroplanes to 525 units is = number of units of potatoes lost / number of units of airplanes gained
= 200/ 75 = 2.67. The number of units of potatoes lost = 900 -700 on moving from point C to point D.
iii) The opportunity cost per unit of increasing the annual output of potatoes from 700 to 900 units is = number of units of aeroplanes lost/ number of units of potatoes gained
= 75/200 = 0.375. The number of potatoes gained 75 = 525- 450 on moving from point D to point C .
iv) The production possibility graph shows the combination of goods and services in the economy that has been produced efficiently in the economy at that point of time, using the available input. Here, for example to produce more units of potatoes on the production possibility curve, the production of airplanes must decrease. If an economy is producing the goods efficiently then it is not possible to produce one good without decreasing the production of another good. The negative slope of the production possibility curve indicates the opportunity cost of the goods. Production of one good cannnot be increased without decreasing the production of another good as goods are efficiently produced on the production possibility curve. Suppose, here from the given graph, we are at point C producing 900 units of potato and 450 units of aeroplane. If we want to move from point C to point B, then we increase the production of potatoes to 1100 from 900 but at the cost of aeroplanes. The production of aeroplane decreases by 100 units from 450 units to 350 units. Therefore, the opportunity cost of producing 200more units of potatoes at point C is the reduction of aeroplane by 100 units. Hence, the curve is negatively sloping as to produce one extra unit of any of the two goods the other good has to be reduced.
(v) The production possibility curve is concave in origin to show increased opportunity cost with increased output of the good. The slope of the curve at any point in time is called the marginal rate of transformation (MRT). The slope also defines the rate at which the resources can be redirected or r allocated to the production of another good. It is also commonly kno n and the opportunity cost. The opportunity cost is increasing in this case of concave production possibility curve. The shape of the ppf is concave to show the increased opportunity cost of the goods. Hence, the MRT increases in absolute value from the top of the curve till the bottom of the curve. From this graph given here, we can see for every 200 units reduction of potatoes the percentage of increase in the output of aeroplanes decreases. Hence,the ppf is concave in shape.
(v) In the case of a concave production possibility curve, the opportunity cost is increasing, in case of a convex one the opportunity cost is decreasing and that of a straight one the opportunity cost is constant. In case of constant opportunity cost, for every increase in the production of good 'X' the decrease in the production of good 'Y' will be the same.
Add Answer to:
# 2. In a given country, only two good on the production possibility frontier: s are...
enêtre Aide 67% d Review Questions Ch1 and Ch2.ECO 2302 Jan 22.pdf (page 1 sur 2)...
 enêtre Aide 67% d Review Questions Ch1 and Ch2.ECO 2302 Jan 22.pdf (page 1 sur 2) #1 . Ina given country, only two goods are produced: rice or airplanes. Here are the points onthe production possibility frontier Maximum Annual Output Options Rice Airplanes 1600 250 1000 350 İGB INTERNATIONAL UNIVERSITY OF GRAND-BASSANM 475 500 ) Draw a production possibility frontier with the quantity of rice on the horizontal axis. (ii) What is the opportunity cost per unit of expending production...
The fact that a society's production possibility frontier is bowed out, or concave to the origin...
The fact that a society's production possibility frontier is bowed out, or concave to the origin of a graph, demonstrates the law of _____ opportunity cost. concave constant increasing decreasing
3. BONUS. A production possibility frontier (curve). Bill Swartz has four fields spread out over a...
 3. BONUS. A production possibility frontier (curve). Bill Swartz has four fields spread out over a hillside. He can grow either wheat or potatoes in any of the fields, but the low fields are better for potatoes and the high ones are better for wheat. Here are some com- binations of wheat and potatoes that he could produce: Number of Fields Number of Fields Total Tons of Potatoes Total Tons of Wheat Used for Potatoes Used for Wheat Produced Produced...
A production possibility frontier is made up from all of the combinations of two goods or...
A production possibility frontier is made up from all of the combinations of two goods or services that can be efficiently produced with the currently available resources and technology. True or False The PPF is curved (bowed) outward from the origin because resources are limited. True or False The slope of the PPF (in absolute value) shows the opportunity cost as production is switched from one good or service to another. True or False One can calculate the opportunity cost...
3. Suppose an economy has a production possibility frontier characterized by the equation x2+4Y2 100 a....
 3. Suppose an economy has a production possibility frontier characterized by the equation x2+4Y2 100 a. In order to sketch this equation, first compute its intercepts. What is the value b. Calculate three additional points along this production possibility frontier. c. Is the opportunity cost of X in terms of Y constant in this economy, or does it d. How would you calculate the opportunity cost of X in terms of Y in this of Xif Y-0? What is the...
Production Possibility Frontier-Country X 9 A 15,7 10,6 15, 4 10,4 18, 2 20,0 20 10...
 Production Possibility Frontier-Country X 9 A 15,7 10,6 15, 4 10,4 18, 2 20,0 20 10 15 25 MP3 Players Daily production Consider the Production Possibility Frontier for country X producing 2 groups of goods, MP3 players and watches. The opportunity cost of moving from the combination of MP3 players and watches B to C is 2 watches. 4 watches. O 5 MP3 players
An economy has a production possibility frontier given by X2 + 4Y2 = 100. (i) Graph...
An economy has a production possibility frontier given by X2 + 4Y2 = 100. (i) Graph this ppf. (ii) Calculate the opportunity cost of an extra unit of good X when a. X = 2 b. X = 8. [Hint: you need ΔY/ΔX; either use calculus; or calculate Y when X=2 and X=3 to get an approximation. Excel might be helpful for this.] (iii) If consumers want to consume equal amounts of X and Y, how much of each should...
Suppose an economy E has a production possibility frontier characterized by the following equation: Y = - X 2 + 400 a. D...
Suppose an economy E has a production possibility frontier characterized by the following equation: Y = - X 2 + 400 a. Draw the PPF b. Calculate 3 opportunity costs between 4 different points on the PPF, is it constant, or does it depend on the levels of output produced? c. Where does the point A = (10, 250) fall? Explain what it means. Where does the point B = (15, 200) fall? Explain what it means. Where should we...
Question 12 State the Heckscher-Ohlin Theorem. Suppose there are two countries, USA and Germany. USA is...
Question 12 State the Heckscher-Ohlin Theorem. Suppose there are two countries, USA and Germany. USA is regarded as the home country and Germany is the foreign country. USA has 100 units of labor available and Germany has 80 units of labor. Both countries can produce only two goods, airplanes and cars. The output per hour of labor in the production of airplanes in the USA is 12, while in car production the output per hour of labor is 6. In...
Figure 2-1 4) Refer to Figure 2-1. Point A is A) technically efficient. B) unattainable with...
Figure 2-1 4) Refer to Figure 2-1. Point A is A) technically efficient. B) unattainable with current resources. C) inefficient in that not all resources are being used. D) the equilibrium output combination. 5) Refer to Figure 2-1. Point B is A) technically efficient. B) unattainable with current resources. C) inefficient in that not all resources are being used. D) the equilibrium output combination. 6) Refer to Figure 2-1. Point C is A) technically efficient. B) unattainable with current resources....
 enêtre Aide 67% d Review Questions Ch1 and Ch2.ECO 2302 Jan 22.pdf (page 1 sur 2) #1 . Ina given country, only two goods are produced: rice or airplanes. Here are the points onthe production possibility frontier Maximum Annual Output Options Rice Airplanes 1600 250 1000 350 İGB INTERNATIONAL UNIVERSITY OF GRAND-BASSANM 475 500 ) Draw a production possibility frontier with the quantity of rice on the horizontal axis. (ii) What is the opportunity cost per unit of expending production...
 3. BONUS. A production possibility frontier (curve). Bill Swartz has four fields spread out over a hillside. He can grow either wheat or potatoes in any of the fields, but the low fields are better for potatoes and the high ones are better for wheat. Here are some com- binations of wheat and potatoes that he could produce: Number of Fields Number of Fields Total Tons of Potatoes Total Tons of Wheat Used for Potatoes Used for Wheat Produced Produced...
 3. Suppose an economy has a production possibility frontier characterized by the equation x2+4Y2 100 a. In order to sketch this equation, first compute its intercepts. What is the value b. Calculate three additional points along this production possibility frontier. c. Is the opportunity cost of X in terms of Y constant in this economy, or does it d. How would you calculate the opportunity cost of X in terms of Y in this of Xif Y-0? What is the...
 Production Possibility Frontier-Country X 9 A 15,7 10,6 15, 4 10,4 18, 2 20,0 20 10 15 25 MP3 Players Daily production Consider the Production Possibility Frontier for country X producing 2 groups of goods, MP3 players and watches. The opportunity cost of moving from the combination of MP3 players and watches B to C is 2 watches. 4 watches. O 5 MP3 players
Most questions answered within 3 hours.
-
a bottle cap manufacturer with four machines and six operators
wants to see if variation in...
asked 24 minutes ago -
State Farm Insurance studies show that in Colorado, 55% of the
auto insurance claims submitted for...
asked 1 hour ago -
Complete the following reactions which form ethers (A
and B) and cyclic ethers (C-E) as major...
asked 1 hour ago -
in a perfectly elastic collision what is the velocity of ball A
if the original direction...
asked 1 hour ago -
PLEASE ANSWER ALL
1) The pressure of the atmosphere decreases with increasing
altitude in the
Choose...
asked 2 hours ago -
A simple random sample of 25,000 individuals are surveyed in
order to determine the prevalence of...
asked 2 hours ago -
People who do very detailed work close up, such as jewelers,
often can see objects clearly...
asked 2 hours ago -
14 years ago, Blue Lake Corp. issued 30 year to maturity
zero-coupon bonds with a par...
asked 2 hours ago -
Warnerwoods Company uses a perpetual inventory system. It
entered into the following purchases and sales transactions...
asked 2 hours ago -
Equivalent Units of Conversion Costs
The Rolling Department of Oak Ridge Steel Company had 6,842 tons...
asked 2 hours ago -
what does the concept of "core competence" mean? why
is this concept important? How would you...
asked 2 hours ago -
__________ is a type of visualization that is linked to strategy
and used within a formal...
asked 2 hours ago