

Homework Answers
Let's enter data in excel and do the calculations:

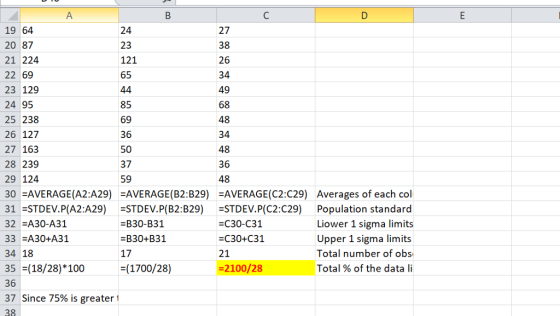
The formulae used on the above excel-sheet are as follows:
Add Answer to:
This is stat question and the data show as below This is stat question and the...
These are my instructions: Your data should have been read in from the data file and stored into ...
These are my instructions: Your data should have been read in from the data file and stored into an array. Next you need to calculate the following and display in a single Message box: Average score Highest score Lowest score Mode of the scores Your program should be written using methods and should be well documented internally and externally. Your output should be displayed using Message boxes. This is the .text file to use with the instructions: 20 21 22...
Sample Data Sample Data Hour Sample Taken Hour Sample Taken 1 4 5 X 1 3...
 Sample Data Sample Data Hour Sample Taken Hour Sample Taken 1 4 5 X 1 3 1 42 2 3 4 5 6 2 39 36 25 60 28 53 22 56 41 34 43 45 59 42 36 40 45 39 48 26 42 34 61 48 45 29 3 31 61 38 40 54 26 38 42 37 41 53 37 47 41 37 29 20 26 43 38 33 37 37 35 33 36 41 25 37...
Please show how you did this in excel. :13-19 Every home football game for the past...
 Please show how you did this in excel.
:13-19 Every home football game for the past eight years at Eastern State University has been sold out. The revenues from ticket sales are significant, but the sale of food, beverages, and souvenirs has contrib- uted greatly to the overall profitability of the football program. One particular souvenir is the football pro- gram for each game. The number of programs sold at each game is described by the following probabil- ity distribution:...
Please show how you did this in excel.
:13-19 Every home football game for the past eight years at Eastern State University has been sold out. The revenues from ticket sales are significant, but the sale of food, beverages, and souvenirs has contrib- uted greatly to the overall profitability of the football program. One particular souvenir is the football pro- gram for each game. The number of programs sold at each game is described by the following probabil- ity distribution:...
I literally have no idea what I’m doing. Help!!! Please show work!! Write an essay using...
 I literally have no idea what I’m doing. Help!!! Please show
work!!
Write an essay using Word and post it as an attachment to the discussion. Cover the following points. Choose a data set from Stat Disk using one of the following files from 13th Edition Elementary Statistics: Oscar Winner Freshman 15 Word Count Garbage Weights Passive and Active Smoke If the file contains more than one variable, choose a quantitative variable. Create a histogram using your chosen variable and...
I literally have no idea what I’m doing. Help!!! Please show
work!!
Write an essay using Word and post it as an attachment to the discussion. Cover the following points. Choose a data set from Stat Disk using one of the following files from 13th Edition Elementary Statistics: Oscar Winner Freshman 15 Word Count Garbage Weights Passive and Active Smoke If the file contains more than one variable, choose a quantitative variable. Create a histogram using your chosen variable and...
Suppose a binary tree data (in tiny written size) is stored in an array (A) as...
Suppose a binary tree data (in tiny written size) is stored in an array (A) as given below and root is placed at “0”index. Note the array indices are in larger written size (0 to 74). Show the traversal data of the given tree for a) In-Order Traversal b) Post Order Traversal A 0 1 2 3 4 5 6 7 8 9 10 11 12 13 14 3 28 13 36 15 9 22 44 7 10 75 33 19 15...
This is stat question and the data show as below This is stat question and the...
 This is stat question and the data show as below
 Flows in the Credit River in Mississauga are given in the file 'credit.MP]' or in the file 'credit.xlsx. 29331 2 1 3321 23234 8 6 4 3 3 2 4 25274431 5 5 863535 2 2 8-7 2 3 2 3 2 9 6 4 3 2 31 - 2 78901 2345678901 23456789 11122222222223333333333 2 February and August calculate the...
This is stat question and the data show as below
This is stat question and the data show as below Flows in the Credit River in Mississauga are given in the file 'credit.MP]' or in the file 'credit.xlsx. 29331 2 1 3321 23234 8 6 4 3 3 2 4 25274431 5 5 863535 2 2 8-7 2 3 2 3 2 9 6 4 3 2 31 - 2 78901 2345678901 23456789 11122222222223333333333 2 February and August calculate the...
can someone take a look to these 3 pictures and fill in the blanks. I need...
 can someone take a look to these 3 pictures and fill
in the blanks. I need to show work and understand the answers.
thank you!
Birth to 36 months: Girls Head circumference-for-age and Welght-for-length percentiles NAME RECORD # Birth 3 69 12 15 18 21 24 27 30 33 36 AGE (MONTHS cm in ina cm 52 19--48 46 46-18 42 50 22 48 15--38 2044 19--42 18-40 38 36 34 -32 13 16 13 28 E 11 24 H...
can someone take a look to these 3 pictures and fill
in the blanks. I need to show work and understand the answers.
thank you!
Birth to 36 months: Girls Head circumference-for-age and Welght-for-length percentiles NAME RECORD # Birth 3 69 12 15 18 21 24 27 30 33 36 AGE (MONTHS cm in ina cm 52 19--48 46 46-18 42 50 22 48 15--38 2044 19--42 18-40 38 36 34 -32 13 16 13 28 E 11 24 H...
48 57 Amy Bakery has four shops in different area in a city. Monthly sales (in...
 48 57 Amy Bakery has four shops in different area in a city. Monthly sales (in thousands of dollars) from a random of 24 months from each of the 4 shops given in Table 1. Table 1: Monthly sales (in thousands of dollars) North East South West 77 75 97 60 45 42 60 54 56 49 68 47 44 39 58 57 63 61 69 51 75 63 79 50 90 81 99 73 32 47 46 41 41...
NUMBER OF PEOPLE 10.2 10.0 10.1 8.5 10.2 8.2 8 Source: United States Census. 11. In...
 NUMBER OF PEOPLE 10.2 10.0 10.1 8.5 10.2 8.2 8 Source: United States Census. 11. In the Sanitary District of Chicago, operating engineers are hired on of a competitive civil-service examination. In 1966, there were 223 appl for 15 jobs. The exam was held on March 12; the test scores are s arranged in increasing order. The height of each bar in the histogram next page) shows the number of people with the correspondin examiners were charged with rigging the...
Write a python nested for loop that prints out the following pattern 100 99 98 97...
Write a python nested for loop that prints out the following pattern 100 99 98 97 96 95 94 93 92 91 90 89 88 87 86 85 84 83 82 81 80 79 78 77 76 75 74 73 72 71 70 69 68 67 66 65 64 63 62 61 60 59 58 57 56 55 54 53 52 51 50 49 48 47 46 45 44 43 42 41 40 39 38 37 36 35 34 33...
 Sample Data Sample Data Hour Sample Taken Hour Sample Taken 1 4 5 X 1 3 1 42 2 3 4 5 6 2 39 36 25 60 28 53 22 56 41 34 43 45 59 42 36 40 45 39 48 26 42 34 61 48 45 29 3 31 61 38 40 54 26 38 42 37 41 53 37 47 41 37 29 20 26 43 38 33 37 37 35 33 36 41 25 37...
 Please show how you did this in excel.
:13-19 Every home football game for the past eight years at Eastern State University has been sold out. The revenues from ticket sales are significant, but the sale of food, beverages, and souvenirs has contrib- uted greatly to the overall profitability of the football program. One particular souvenir is the football pro- gram for each game. The number of programs sold at each game is described by the following probabil- ity distribution:...
Please show how you did this in excel.
:13-19 Every home football game for the past eight years at Eastern State University has been sold out. The revenues from ticket sales are significant, but the sale of food, beverages, and souvenirs has contrib- uted greatly to the overall profitability of the football program. One particular souvenir is the football pro- gram for each game. The number of programs sold at each game is described by the following probabil- ity distribution:...
 I literally have no idea what I’m doing. Help!!! Please show
work!!
Write an essay using Word and post it as an attachment to the discussion. Cover the following points. Choose a data set from Stat Disk using one of the following files from 13th Edition Elementary Statistics: Oscar Winner Freshman 15 Word Count Garbage Weights Passive and Active Smoke If the file contains more than one variable, choose a quantitative variable. Create a histogram using your chosen variable and...
I literally have no idea what I’m doing. Help!!! Please show
work!!
Write an essay using Word and post it as an attachment to the discussion. Cover the following points. Choose a data set from Stat Disk using one of the following files from 13th Edition Elementary Statistics: Oscar Winner Freshman 15 Word Count Garbage Weights Passive and Active Smoke If the file contains more than one variable, choose a quantitative variable. Create a histogram using your chosen variable and...
 This is stat question and the data show as below
 Flows in the Credit River in Mississauga are given in the file 'credit.MP]' or in the file 'credit.xlsx. 29331 2 1 3321 23234 8 6 4 3 3 2 4 25274431 5 5 863535 2 2 8-7 2 3 2 3 2 9 6 4 3 2 31 - 2 78901 2345678901 23456789 11122222222223333333333 2 February and August calculate the...
This is stat question and the data show as below
This is stat question and the data show as below Flows in the Credit River in Mississauga are given in the file 'credit.MP]' or in the file 'credit.xlsx. 29331 2 1 3321 23234 8 6 4 3 3 2 4 25274431 5 5 863535 2 2 8-7 2 3 2 3 2 9 6 4 3 2 31 - 2 78901 2345678901 23456789 11122222222223333333333 2 February and August calculate the...
 can someone take a look to these 3 pictures and fill
in the blanks. I need to show work and understand the answers.
thank you!
Birth to 36 months: Girls Head circumference-for-age and Welght-for-length percentiles NAME RECORD # Birth 3 69 12 15 18 21 24 27 30 33 36 AGE (MONTHS cm in ina cm 52 19--48 46 46-18 42 50 22 48 15--38 2044 19--42 18-40 38 36 34 -32 13 16 13 28 E 11 24 H...
can someone take a look to these 3 pictures and fill
in the blanks. I need to show work and understand the answers.
thank you!
Birth to 36 months: Girls Head circumference-for-age and Welght-for-length percentiles NAME RECORD # Birth 3 69 12 15 18 21 24 27 30 33 36 AGE (MONTHS cm in ina cm 52 19--48 46 46-18 42 50 22 48 15--38 2044 19--42 18-40 38 36 34 -32 13 16 13 28 E 11 24 H...
 48 57 Amy Bakery has four shops in different area in a city. Monthly sales (in thousands of dollars) from a random of 24 months from each of the 4 shops given in Table 1. Table 1: Monthly sales (in thousands of dollars) North East South West 77 75 97 60 45 42 60 54 56 49 68 47 44 39 58 57 63 61 69 51 75 63 79 50 90 81 99 73 32 47 46 41 41...
 NUMBER OF PEOPLE 10.2 10.0 10.1 8.5 10.2 8.2 8 Source: United States Census. 11. In the Sanitary District of Chicago, operating engineers are hired on of a competitive civil-service examination. In 1966, there were 223 appl for 15 jobs. The exam was held on March 12; the test scores are s arranged in increasing order. The height of each bar in the histogram next page) shows the number of people with the correspondin examiners were charged with rigging the...
Most questions answered within 3 hours.
-
Calculate the number density of argon gas at a temperature of
24C and a pressure of...
asked 1 hour ago -
Alternative
Classification
How to Estimate
Probabilities from Data? ( For continuous Attributes)
And How to generate...
asked 1 hour ago -
An explosion breaks a 20.0-kg object into three parts. The
object is initially moving at a...
asked 2 hours ago -
Calculate the approximate number of residues of Rubisco, which
is involved in carbon fixation in plants,...
asked 3 hours ago -
Other decisions about scientific claims can have a much broader
impact.ENERGYarrow-10x10.png, environment, health, security - all...
asked 4 hours ago -
I need to write a research paper and work cited about this
topic: The United States...
asked 4 hours ago -
Hello! I was wondering if I could have some help?
If the vapor pressure of carvone...
asked 5 hours ago -
An economist wants to estimate the mean per capita income (in
thousands of dollars) for a...
asked 5 hours ago -
What would be the input/output characteristic of a circuit
obtained by putting two of your 2's-complementers...
asked 5 hours ago -
In Drosophila, the transition from the syncytial blastoderm
stage to the cellular blastoderm stage is a...
asked 6 hours ago -
Project management question:
Name 3 different types of resources (hint: humans are one
type)
asked 6 hours ago -
Consider the following reaction: C 2H 2( g) + 2H 2( g) C 2H 6(
g)...
asked 6 hours ago