
Homework Answers

Add Answer to:
Consider the historical data for an investment given in the following table: What is the total...
Consider the historical data for an investment given in the following table: What is the total...
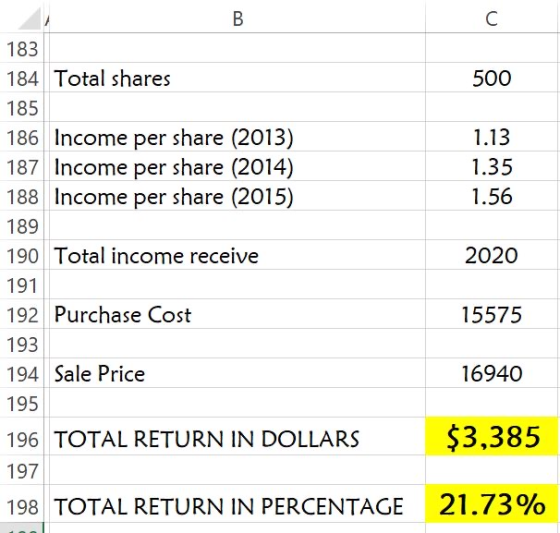
Consider the historical data for an investment given in the following table: What is the total return in dollars and as a percentage of your original investment if you purchased 300 shares of the investment at the beginning of 2013 and sold it at the end of 2015? Market Value (Price) Year Income Beginning Ending Capital gain in dollars In percentage 2013 $1.13 $32.29 $35.57 3.28 4.41 13.66% 2014 $1.29 $35.57 $37.68 2.11 3.4 9.56% 2015 $1.53 $37.68 $35.64 -2.04...
QUE// Consider the historical data for an investment given in the accompanying table. Calculate the total...
QUE// Consider the historical data for an investment given in the accompanying table. Calculate the total return (in dollars) for each year. Indicate the level of return you would expect in 2018 and in 2019. Comment on your forecast. Market value Year Income Beginning Ending 2013 $1.00 $30.00 $32.50 2014 $1.20 $ 32 .50 $35.00 2015 $1.30 $35. 00 $33.00 2016 $ 1.60 $ 33.00 $40.00 2017 $ 1.75 $ 40.00 $ 45.00 Refer to the table above, what...
Return calculations For the investment shown in the following table, calculate the rate of return earned...
Return calculations For the investment shown in the following table, calculate the rate of return earned over the unspecified time period. (Click on the icon located on the top-right corner of the data table below in order to copy its contents into a spreadsheet.) Cash flow during period Beginning-of- period value End-of- period value $3,650 $40,400 $45,800 The rate of return on the investment is%. (Round to two decimal places. If there is a loss, enter as a...
The table below contains data on Fincorp Inc. The balance sheet items correspond to values at...
 The table below contains data on Fincorp Inc. The balance sheet items correspond to values at year-end 2015 and 2016, while the income statement items correspond to revenues or expenses during the year ending in either 2015 or 2016. All values are in thousands of dollars. Revenue Cost of goods sold Depreciation Inventories Administrative expenses Interest expense Federal and state taxes Accounts payable Accounts receivable Net fixed assets Long-term debt Notes payable Dividends paid Cash and marketable securities 2015 $4,000...
The table below contains data on Fincorp Inc. The balance sheet items correspond to values at...
 The table below contains data on Fincorp Inc. The balance sheet items correspond to values at year-end 2015 and 2016, while the income statement items correspond to revenues or expenses during the year ending in either 2015 or 2016. All values are in thousands of dollars. Revenue Cost of goods sold Depreciation Inventories Administrative expenses Interest expense Federal and state taxes Accounts payable Accounts receivable Net fixed assetst Long-term debt Notes payable Dividends paid Cash and marketable securities 2015 $4,000...
The table below contains data on Fincorp Inc. The balance sheet items correspond to values at...
 The table below contains data on Fincorp Inc. The balance sheet items correspond to values at year-end 2015 and 2016, while the income statement items correspond to revenues or expenses during the year ending in either 2015 or 2016. All values are in thousands of dollars. Revenue Cost of goods sold Depreciation Inventories Administrative expenses Interest expense Federal and state taxes* Accounts payable Accounts receivable Net fixed assets Long-term debt Notes payable Dividends paid Cash and marketable securities 2015 $4,000...
Table 1 2012-2016 Financial Statement Data and Stock Price Data for MyNature Income Statement MyNature Corp....
 Table 1 2012-2016 Financial Statement Data and Stock Price Data for MyNature Income Statement MyNature Corp. 2012-2016(All data as of fiscal year end; S in millions) 2012 2013 2014 2015 2016 404.3363.8 424.6 510.7 604.1 188.3 -173.8 -206.2 -246.8 -293.4 216 218.4 263.9 310.7 66.7 -66.4 82.8-102. -120.8 -60.6 -59.-59.466.4 78.5 27.3-2734.3 38.4 -38.6 57 72.8 33.7 32.9-32.2 -37.4 -39.4 9.7 19.6 33.4 3.4 -6.9 11.7 6.3 127 21.7 Revenue Cost of Goods Sold Gross proft Sales and Marketing Administration...
The table below contains data on Fincorp Inc. The balance sheet items correspond to values at...
 The table below contains data on Fincorp Inc. The balance sheet items correspond to values at year-end 2015 and 2016, while the income statement items correspond to revenues or expenses during the year ending in either 2015 or 2016. All values are in thousands of dollars. Revenue Cost of goods sold Depreciation Inventories Administrative expenses Interest expense Federal and state taxes* Accounts payable Accounts receivable Net fixed assetst Long-term debt Notes payable Dividends paid Cash and marketable securities $4,000 1,600...
2) The following table provides data for an economy in a certain year 1,000 700 600...
 2) The following table provides data for an economy in a certain year 1,000 700 600 Consumption expenditures Government purchases of goods and services Construction of new homes and apartments Sales of existing homes and apartments 500 Government payments to retirees Household purchases of durable goods Beginning-of-year inventory End-of-year inventory Business fixed investment 600 300 Given the data in the table, compute the investment component of GDP A) 900 B) 400 C) 300 D) 800 3) The following table provides...
The table below contains data on Fincorp Inc. The balance sheet items correspond to values at...
 The table below contains data on Fincorp Inc. The balance sheet items correspond to values at year-end of 2013 and 2014, while the income statement items correspond to revenues or expenses during the year ending in either 2013 or 2014. All values are in thousands of dollars. Revenue Cost of goods sold Depreciation Inventories Administrative expenses Interest expense Federal and state taxes* Accounts payable Accounts receivable Net fixed assetst Long-term debt Notes payable Dividends paid Cash and marketable securities 2013...
 The table below contains data on Fincorp Inc. The balance sheet items correspond to values at year-end 2015 and 2016, while the income statement items correspond to revenues or expenses during the year ending in either 2015 or 2016. All values are in thousands of dollars. Revenue Cost of goods sold Depreciation Inventories Administrative expenses Interest expense Federal and state taxes Accounts payable Accounts receivable Net fixed assets Long-term debt Notes payable Dividends paid Cash and marketable securities 2015 $4,000...
 The table below contains data on Fincorp Inc. The balance sheet items correspond to values at year-end 2015 and 2016, while the income statement items correspond to revenues or expenses during the year ending in either 2015 or 2016. All values are in thousands of dollars. Revenue Cost of goods sold Depreciation Inventories Administrative expenses Interest expense Federal and state taxes Accounts payable Accounts receivable Net fixed assetst Long-term debt Notes payable Dividends paid Cash and marketable securities 2015 $4,000...
 The table below contains data on Fincorp Inc. The balance sheet items correspond to values at year-end 2015 and 2016, while the income statement items correspond to revenues or expenses during the year ending in either 2015 or 2016. All values are in thousands of dollars. Revenue Cost of goods sold Depreciation Inventories Administrative expenses Interest expense Federal and state taxes* Accounts payable Accounts receivable Net fixed assets Long-term debt Notes payable Dividends paid Cash and marketable securities 2015 $4,000...
 Table 1 2012-2016 Financial Statement Data and Stock Price Data for MyNature Income Statement MyNature Corp. 2012-2016(All data as of fiscal year end; S in millions) 2012 2013 2014 2015 2016 404.3363.8 424.6 510.7 604.1 188.3 -173.8 -206.2 -246.8 -293.4 216 218.4 263.9 310.7 66.7 -66.4 82.8-102. -120.8 -60.6 -59.-59.466.4 78.5 27.3-2734.3 38.4 -38.6 57 72.8 33.7 32.9-32.2 -37.4 -39.4 9.7 19.6 33.4 3.4 -6.9 11.7 6.3 127 21.7 Revenue Cost of Goods Sold Gross proft Sales and Marketing Administration...
 The table below contains data on Fincorp Inc. The balance sheet items correspond to values at year-end 2015 and 2016, while the income statement items correspond to revenues or expenses during the year ending in either 2015 or 2016. All values are in thousands of dollars. Revenue Cost of goods sold Depreciation Inventories Administrative expenses Interest expense Federal and state taxes* Accounts payable Accounts receivable Net fixed assetst Long-term debt Notes payable Dividends paid Cash and marketable securities $4,000 1,600...
 2) The following table provides data for an economy in a certain year 1,000 700 600 Consumption expenditures Government purchases of goods and services Construction of new homes and apartments Sales of existing homes and apartments 500 Government payments to retirees Household purchases of durable goods Beginning-of-year inventory End-of-year inventory Business fixed investment 600 300 Given the data in the table, compute the investment component of GDP A) 900 B) 400 C) 300 D) 800 3) The following table provides...
 The table below contains data on Fincorp Inc. The balance sheet items correspond to values at year-end of 2013 and 2014, while the income statement items correspond to revenues or expenses during the year ending in either 2013 or 2014. All values are in thousands of dollars. Revenue Cost of goods sold Depreciation Inventories Administrative expenses Interest expense Federal and state taxes* Accounts payable Accounts receivable Net fixed assetst Long-term debt Notes payable Dividends paid Cash and marketable securities 2013...
Most questions answered within 3 hours.
-
MATLAB HW 11 problem using Switch Case and Input commands
Write a script file that calculates...
asked 10 minutes ago -
A college student is employed as a door-to-door newspaper
salesman. Historical data suggests that the student...
asked 25 minutes ago -
Considering gravitational time dilation, calculate the time that
passes in Earth’s surface while 1 hour passes...
asked 49 minutes ago -
Minitab Problem: Take the Lake Hume June rainfall data and find
use the processes outlined in...
asked 1 hour ago -
X Company is trying to decide whether to continue using old
equipment to make Product A...
asked 1 hour ago -
IN PYTHON ONLY !! Program 2: Re-work
program #5 (WeeklyHours) from the previous assignment such that...
asked 2 hours ago -
The average length of time between arrivals at a turnpike
toll-booth is 26 seconds. What is...
asked 3 hours ago -
(a) A piston at 6.1 atm contains a gas that occupies a volume of
3.5 L....
asked 5 hours ago -
Please answer true or false. Words
cannot be changed or added in to make it true...
asked 5 hours ago -
An empty test tube weighs 15.923 grams. Then,
MgCl2•6H2O is added into the test tube. After...
asked 5 hours ago -
Assume memory access is 10 units of time and disk access is
10000 units of time....
asked 5 hours ago -
1. Are all good samples random?
2. Magazines often report surveys giving statistics such as “63%...
asked 5 hours ago