
Homework Answers
Add Answer to:
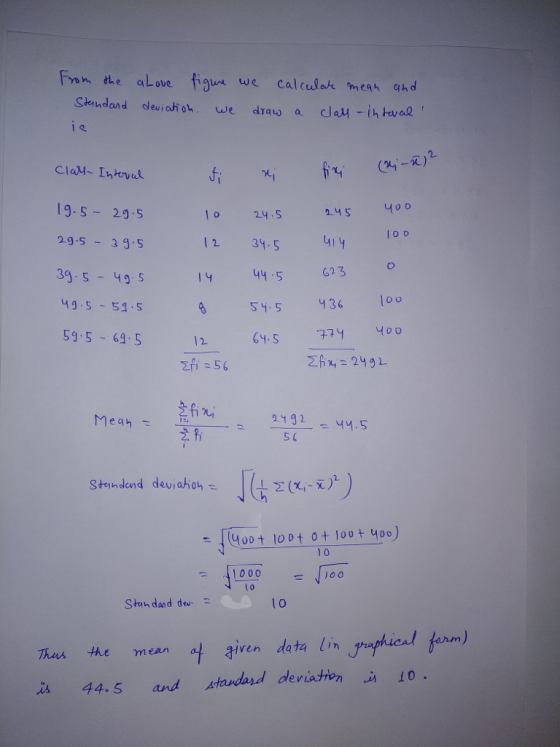
2. Consider the histogram of a randomly selected sample is given below: 14 12 10 8...
I. The data below set represents the scores of 12 randomly selected students on the SAT...
 I. The data below set represents the scores of 12 randomly selected students on the SAT Physics Subject Test. Assume the population test scores are normally distributed and the population standard deviation is 104. 590 450 490 680 380 500 570 620 640 530 780 720 /2 (a) Find the point estimate of the population mean. (b) Construct a 90% confidence interval for the population mean. Interpret the results. (c) Does it seem possible that the population mean could equal...
3. Scores of 12 randomly selected exams in a statistic class are given below: 98 78...
 3. Scores of 12 randomly selected exams in a statistic class are given below: 98 78 90 70 80 55 78 77 70 80 78 86 (a) (6 points) Find the mean and standard deviation. Round your answer to a whole number. It has been reported that the mean score of all statistics exams is below 80. Test the validity of the report at a = 0.02 by using the data given above. (b) (4 points) Clearly state H, and...
4. Scores of 10 randomly selected exams in a statistic class are given below: 98 78...
 4. Scores of 10 randomly selected exams in a statistic class are given below: 98 78 90 70 80 55 78 77 70 80 (a) (4 points) Find the mean and standard deviation. Round your answer to a whole number. (a) It has been reported that the mean score of all statistics exams is greater than 75. Test the validity of the report at a = 0.02 by using the data given above. (b) (4 points) Clearly state H, and...
Question 4 (10 points) Suppose a new standardized test is given to 100 randomly selected third-...
 Question 4 (10 points) Suppose a new standardized test is given to 100 randomly selected third- on the test is 58, and the grade students in New Jersey. The sample average score sample standard deviation, sy, is 8. evel. (a) Test Ho : μY-60 vs H1 : μYメ60 at a 1% significance (b) Construct a 90% confidence interval for the mean score of all New Jersey third graders (c) Suppose the same test is given to 200 randomly selected third...
price earning ratios of 100randomly selected shares are: please find a) mean and b) standard deviation...
 price earning ratios of 100randomly selected shares are:
please find a) mean and b) standard deviation
Interval -0.5-4.5 4.5-9.5 9.5 - 14.5 14.5 - 19.5 19.5 - 24.5 24.5 - 29.5 29.5 - 34.5 Frequency 11 48 25 10 1 3 2
price earning ratios of 100randomly selected shares are:
please find a) mean and b) standard deviation
Interval -0.5-4.5 4.5-9.5 9.5 - 14.5 14.5 - 19.5 19.5 - 24.5 24.5 - 29.5 29.5 - 34.5 Frequency 11 48 25 10 1 3 2
I feel test for a new exam was given to randomly selected seniors the exam was...
 I
feel test for a new exam was given to randomly selected seniors the
exam was graded and then sample mean and simple standard deviation
we are calculated based on the results of the exam creator claims
that on the same exam nine times out of 10 the seniors will have an
average score within 3% and 70% of the coefficients interval was
90% 95% of 99% what is the margin of error calculate the confidence
interval and explain what...
I
feel test for a new exam was given to randomly selected seniors the
exam was graded and then sample mean and simple standard deviation
we are calculated based on the results of the exam creator claims
that on the same exam nine times out of 10 the seniors will have an
average score within 3% and 70% of the coefficients interval was
90% 95% of 99% what is the margin of error calculate the confidence
interval and explain what...
A sample of 14 randomly selected commuters in Chicago showed the average of the commuting times...
A sample of 14 randomly selected commuters in Chicago showed the average of the commuting times was 33.2 minutes. If the standard decision was 8.3 minutes, find the confidence interval of the true mean.
Suppose a new standardized test is given to 98 randomly selected third-grade students in New Jersey....
 Suppose a new standardized test is given to 98 randomly selected third-grade students in New Jersey. The sample average score Y on the test is 57 points, and the sample standard deviation, sy, is 10 points. The authors plan to administer the test to all third-grade students in New Jersey. The 95% confidence interval for the mean score of all New Jersey third graders is ( 55.02, 58.98 ). (Round your responses to two decimal places.) Suppose the same test...
(2) Consider the sample: 9, 6. 7, 9, 10, 8 a) Find: the mean, the median,...
 (2) Consider the sample: 9, 6. 7, 9, 10, 8 a) Find: the mean, the median, the mode b) Find: the range, the quartiles Q1, Q3, the variance, the standard deviation c) Draw a box-plot for the given data set.
Identify the notation for each given number. For a random sample of 575 randomly selected car...
Identify the notation for each given number. For a random sample of 575 randomly selected car batteries, it was found that their output had a mean of 12.3volts and a standard deviation of 1.3volts.
 I. The data below set represents the scores of 12 randomly selected students on the SAT Physics Subject Test. Assume the population test scores are normally distributed and the population standard deviation is 104. 590 450 490 680 380 500 570 620 640 530 780 720 /2 (a) Find the point estimate of the population mean. (b) Construct a 90% confidence interval for the population mean. Interpret the results. (c) Does it seem possible that the population mean could equal...
 3. Scores of 12 randomly selected exams in a statistic class are given below: 98 78 90 70 80 55 78 77 70 80 78 86 (a) (6 points) Find the mean and standard deviation. Round your answer to a whole number. It has been reported that the mean score of all statistics exams is below 80. Test the validity of the report at a = 0.02 by using the data given above. (b) (4 points) Clearly state H, and...
 4. Scores of 10 randomly selected exams in a statistic class are given below: 98 78 90 70 80 55 78 77 70 80 (a) (4 points) Find the mean and standard deviation. Round your answer to a whole number. (a) It has been reported that the mean score of all statistics exams is greater than 75. Test the validity of the report at a = 0.02 by using the data given above. (b) (4 points) Clearly state H, and...
 Question 4 (10 points) Suppose a new standardized test is given to 100 randomly selected third- on the test is 58, and the grade students in New Jersey. The sample average score sample standard deviation, sy, is 8. evel. (a) Test Ho : μY-60 vs H1 : μYメ60 at a 1% significance (b) Construct a 90% confidence interval for the mean score of all New Jersey third graders (c) Suppose the same test is given to 200 randomly selected third...
 price earning ratios of 100randomly selected shares are:
please find a) mean and b) standard deviation
Interval -0.5-4.5 4.5-9.5 9.5 - 14.5 14.5 - 19.5 19.5 - 24.5 24.5 - 29.5 29.5 - 34.5 Frequency 11 48 25 10 1 3 2
price earning ratios of 100randomly selected shares are:
please find a) mean and b) standard deviation
Interval -0.5-4.5 4.5-9.5 9.5 - 14.5 14.5 - 19.5 19.5 - 24.5 24.5 - 29.5 29.5 - 34.5 Frequency 11 48 25 10 1 3 2
 I
feel test for a new exam was given to randomly selected seniors the
exam was graded and then sample mean and simple standard deviation
we are calculated based on the results of the exam creator claims
that on the same exam nine times out of 10 the seniors will have an
average score within 3% and 70% of the coefficients interval was
90% 95% of 99% what is the margin of error calculate the confidence
interval and explain what...
I
feel test for a new exam was given to randomly selected seniors the
exam was graded and then sample mean and simple standard deviation
we are calculated based on the results of the exam creator claims
that on the same exam nine times out of 10 the seniors will have an
average score within 3% and 70% of the coefficients interval was
90% 95% of 99% what is the margin of error calculate the confidence
interval and explain what...
 Suppose a new standardized test is given to 98 randomly selected third-grade students in New Jersey. The sample average score Y on the test is 57 points, and the sample standard deviation, sy, is 10 points. The authors plan to administer the test to all third-grade students in New Jersey. The 95% confidence interval for the mean score of all New Jersey third graders is ( 55.02, 58.98 ). (Round your responses to two decimal places.) Suppose the same test...
 (2) Consider the sample: 9, 6. 7, 9, 10, 8 a) Find: the mean, the median, the mode b) Find: the range, the quartiles Q1, Q3, the variance, the standard deviation c) Draw a box-plot for the given data set.
Most questions answered within 3 hours.
-
Project management question:
Name 3 different types of resources (hint: humans are one
type)
asked 4 minutes ago -
Consider the following reaction: C 2H 2( g) + 2H 2( g) C 2H 6(
g)...
asked 12 minutes ago -
Consider a 1.0 L buffer containing 0.092 mol L-1 HCOOH and 0.100
mol L-1 HCOO-. What...
asked 21 minutes ago -
Koch Realty has owned a vacant land with a FMV of
$775,000 and an adjusted basis...
asked 26 minutes ago -
It is estimated 29% of all adults in United States invest in
stocks and that 85%...
asked 26 minutes ago -
What does a 2-sided p value of 0.04 mean? (I am not asking if it
is...
asked 40 minutes ago -
A parallel-plate capacitor is made from two aluminum-foil
sheets, each 7.8 cmcm wide and 5.1 mmlong....
asked 42 minutes ago -
1. why is toluene a stronger nucleophile than benzene?
2.why is phenol a stronger nucleophile than...
asked 58 minutes ago -
4. How can you solve for the density of the liquid from the
slope? Please show...
asked 58 minutes ago -
when 2053 j of heat is added to 46.3 g of hexane C6H14 the
temperature increases...
asked 1 hour ago -
I need new and unique answers, please. (Use your own words,
don't copy and paste), Please...
asked 1 hour ago -
MCL 445.111 et seq. deals with Home Solicitation Sales.
MCL stands for Michigan Compiled Laws which...
asked 1 hour ago