Cornerstone Exercise 14.1 (Algorithmic) Quality Cost Report Evans Company had total sales of $1,100,000 for fiscal...
Cornerstone Exercise 14.1 (Algorithmic)
Quality Cost Report
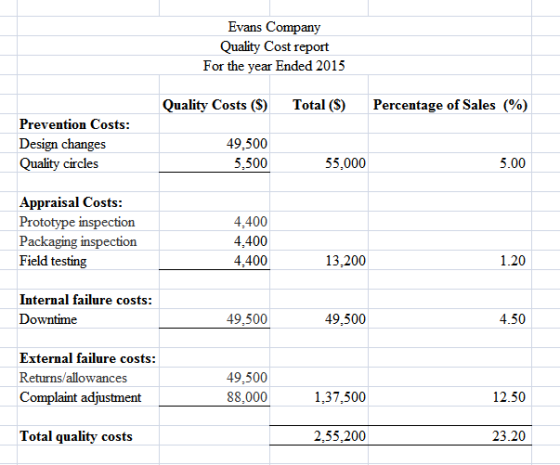
Evans Company had total sales of $1,100,000 for fiscal 2015. The costs of quality-related activities are given below.
| Returns/allowances | $49,500 |
| Design changes | 49,500 |
| Prototype inspection | 4,400 |
| Downtime | 49,500 |
| Quality circles | 5,500 |
| Packaging inspection | 4,400 |
| Field testing | 4,400 |
| Complaint adjustment | 88,000 |
Required:
1. Prepare a quality cost report, classifying costs by category and expressing each category as a percentage of sales. Round percentages to one decimal place, when rounding is required. For example, 5.78% would be entered as "5.8".
|
||||||||||||||||||||||||||||||||||||||||||||||||||||||||||||||||||||||||||||||||||||||||||||||||||||||||||||||||||||||||||||||||||||||||||||||||||||||||||||||||
Homework Answers
Add Answer to:
Cornerstone Exercise 14.1 (Algorithmic)
Quality Cost Report
Evans Company had total sales of $1,100,000 for fiscal...
Quality Cost Report Evans Company had total sales of $3,800,000 for fiscal 20x5. The costs of...
Quality Cost Report Evans Company had total sales of $3,800,000 for fiscal 20x5. The costs of quality-related activities are given below. Returns/allowances $190,000 Design changes 228,000 Prototype inspection 11,400 Downtime 152,000 Quality circles 7,600 Packaging inspection 15,200 Field testing 7,600 Complaint adjustment 209,000 Required: 1. Prepare a quality cost report, classifying costs by category and expressing each category as a percentage of sales. Round percentages to one decimal place, when rounding is required. For example, 5.78% would be entered as...
Quality Cost Report Evans Company had total sales of $1,800,000 for fiscal 20x5. The costs of...
Quality Cost Report Evans Company had total sales of $1,800,000 for fiscal 20x5. The costs of quality-related activities are given below. Returns/allowances $90,000 Design changes 72,000 Prototype inspection 3,600 Downtime 90,000 Quality circles 5,400 Packaging inspection 7,200 Field testing 5,400 Complaint adjustment 90,000 Required: 1. Prepare a quality cost report, classifying costs by category and expressing each category as a percentage of sales. Round percentages to one decimal place, when rounding is required. For example, 5.78% would be entered as...
Evans Company had total sales of $4,000,000 for fiscal 20x5. The costs of quality-related activities are...
 Evans Company had total sales of $4,000,000 for fiscal 20x5. The costs of quality-related activities are given below. S280,000 160.000 Returns/allowances Design changes Prototype inspection Downtime Quality circles 8.000 300,000 16,000 12.000 Packaging inspection Field testing Complaint adjustment 12,000 280,000 Required: 1. Prepare a quality cost report, classifying costs by category and expressing each category as a percentage of sales. Round percentages to one decimal place, when rounding is required. For example, 5.78% would be entered as "5.8", Evans Company...
Cost of Quality: Cost Element Amount Proofreading $800,000 Quality planning 15,000 Press downtime due to system...
Cost of Quality: Cost Element Amount Proofreading $800,000 Quality planning 15,000 Press downtime due to system failure 300,000 Bindery waste due to process failure 80,000 Checking & inspection 55,000 Customer complaint remakes 30,000 Printing plate revisions due to process failure 40,000 Quality improvement projects 25,000 Other waste due to system failure 60,000 Correction of typo errors 250,000 a. Allocate the above items into the proper “Cost of Quality” categories. b. Determine the total in each category and the overall total...
Requirement 1. Prepare a Cost of Quality (COQ) report. In addition to calculating the total costs...
 Requirement 1. Prepare a Cost of Quality (COQ) report. In addition to calculating the total costs of each category, calculate the percentage of COQ category of the total COQ. (Round the percentage to the one tenth of a percent, X.X%. If a box is not used in the table leave the box empty, do not select a label or enter a zero.) Gooding Cost of Quality Report Costs Incurred Total Costs of Quality Percentage of Total Costs of Quality (Rounded)...
Fabrick Company's quality cost report is to be based on the following data: Lost sales due...
Fabrick Company's quality cost report is to be based on the following data: Lost sales due to poor quality $ 15,000 Quality data gathering, analysis, and reporting $ 65,500 Net cost of spoilage $ 67,000 Re-entering data because of keying errors $ 22,900 Test and inspection of in-process goods $ 16,400 Final product testing and inspection $ 41,000 Statistical process control activities $ 40,800 Returns arising from quality problems $ 39,300 Downtime caused by quality problems $ 61,900 What would...
Interim Quality Performance Report Davis, Inc., had the following quality costs for the years end...
 Interim Quality Performance Report
Davis, Inc., had the following quality costs for the years ended
December 31, 2014 and 2015:
2014
2015
Prevention costs:
Quality audits
$62,000
$93,000
Vendor certification
126,500
189,750
Appraisal costs:
Product acceptance
$86,000
$129,000
Process acceptance
95,000
105,000
Internal failure costs:
Retesting
$90,000
$88,000
Rework
173,000
230,000
External failure costs:
Recalls
$130,000
$104,000
Warranty
310,000
318,000
At the end of 2014, management decided to increase its
investment in control costs by 50 percent for each category’s...
Interim Quality Performance Report
Davis, Inc., had the following quality costs for the years ended
December 31, 2014 and 2015:
2014
2015
Prevention costs:
Quality audits
$62,000
$93,000
Vendor certification
126,500
189,750
Appraisal costs:
Product acceptance
$86,000
$129,000
Process acceptance
95,000
105,000
Internal failure costs:
Retesting
$90,000
$88,000
Rework
173,000
230,000
External failure costs:
Recalls
$130,000
$104,000
Warranty
310,000
318,000
At the end of 2014, management decided to increase its
investment in control costs by 50 percent for each category’s...
Environmental Cost Report Verde Company reported operating costs of $43,000,000 as of December 31, 20x5, with...
 Environmental Cost Report Verde Company reported operating costs of $43,000,000 as of December 31, 20x5, with the following environmental costs: Testing for contamination $ 989,000 Inspecting products 430,000 Treating toxic waste 1,548,000 Obtaining ISO 14001 certification 731,000 Designing processes 688,000 Cleaning up oil spills 2,967,000 Maintaining pollution equipment 1,118,000 Cleaning up contaminated soil 5,160,000 Required: 1. Prepare an environmental cost report, classifying costs by quality category and expressing each as a percentage of total operating costs. Round percentages to two...
The manager at Seaside International prepares a Cost of Quality report to report the following expenses:...
 The manager at Seaside International prepares a Cost of Quality report to report the following expenses: Inspection of raw material costs $6,200 Warranty costs for warranty claims $300,000 Cost to dispose of rejected products $15,000 Train hourly manufacturing personnel $60,000 Recall of batch #2894 $200,000 Production losses due to machine malfunctions $27,000 Cost of defective products found at inspection audit $78,000 Inspecting products when halfway through the production process $24,000 What is the total cost of quality in the external...
Exercise 14.12 Quality Cost Report Kang Company reported sales of $3,240,000 in 20x5. At the end...
 Exercise 14.12 Quality Cost Report Kang Company reported sales of $3,240,000 in 20x5. At the end of the calendar year, the fol- lowing quality costs were reported: $162,000 54,000 27,000 21,600 54,000 27,000 18,900 108,000 Design review Recalls Reinspection Materials inspection Quality training Process acceptance Scrap Lost sales Product inspection Returned goods 16,200 51,300 Required: Prepare a quality cost report. 1. Prepare a graph (pie chart or bar graph) that shows the relative distribution of quality costs and comment on...
 Evans Company had total sales of $4,000,000 for fiscal 20x5. The costs of quality-related activities are given below. S280,000 160.000 Returns/allowances Design changes Prototype inspection Downtime Quality circles 8.000 300,000 16,000 12.000 Packaging inspection Field testing Complaint adjustment 12,000 280,000 Required: 1. Prepare a quality cost report, classifying costs by category and expressing each category as a percentage of sales. Round percentages to one decimal place, when rounding is required. For example, 5.78% would be entered as "5.8", Evans Company...
 Requirement 1. Prepare a Cost of Quality (COQ) report. In addition to calculating the total costs of each category, calculate the percentage of COQ category of the total COQ. (Round the percentage to the one tenth of a percent, X.X%. If a box is not used in the table leave the box empty, do not select a label or enter a zero.) Gooding Cost of Quality Report Costs Incurred Total Costs of Quality Percentage of Total Costs of Quality (Rounded)...
 Interim Quality Performance Report
Davis, Inc., had the following quality costs for the years ended
December 31, 2014 and 2015:
2014
2015
Prevention costs:
Quality audits
$62,000
$93,000
Vendor certification
126,500
189,750
Appraisal costs:
Product acceptance
$86,000
$129,000
Process acceptance
95,000
105,000
Internal failure costs:
Retesting
$90,000
$88,000
Rework
173,000
230,000
External failure costs:
Recalls
$130,000
$104,000
Warranty
310,000
318,000
At the end of 2014, management decided to increase its
investment in control costs by 50 percent for each category’s...
Interim Quality Performance Report
Davis, Inc., had the following quality costs for the years ended
December 31, 2014 and 2015:
2014
2015
Prevention costs:
Quality audits
$62,000
$93,000
Vendor certification
126,500
189,750
Appraisal costs:
Product acceptance
$86,000
$129,000
Process acceptance
95,000
105,000
Internal failure costs:
Retesting
$90,000
$88,000
Rework
173,000
230,000
External failure costs:
Recalls
$130,000
$104,000
Warranty
310,000
318,000
At the end of 2014, management decided to increase its
investment in control costs by 50 percent for each category’s...
 Environmental Cost Report Verde Company reported operating costs of $43,000,000 as of December 31, 20x5, with the following environmental costs: Testing for contamination $ 989,000 Inspecting products 430,000 Treating toxic waste 1,548,000 Obtaining ISO 14001 certification 731,000 Designing processes 688,000 Cleaning up oil spills 2,967,000 Maintaining pollution equipment 1,118,000 Cleaning up contaminated soil 5,160,000 Required: 1. Prepare an environmental cost report, classifying costs by quality category and expressing each as a percentage of total operating costs. Round percentages to two...
 The manager at Seaside International prepares a Cost of Quality report to report the following expenses: Inspection of raw material costs $6,200 Warranty costs for warranty claims $300,000 Cost to dispose of rejected products $15,000 Train hourly manufacturing personnel $60,000 Recall of batch #2894 $200,000 Production losses due to machine malfunctions $27,000 Cost of defective products found at inspection audit $78,000 Inspecting products when halfway through the production process $24,000 What is the total cost of quality in the external...
 Exercise 14.12 Quality Cost Report Kang Company reported sales of $3,240,000 in 20x5. At the end of the calendar year, the fol- lowing quality costs were reported: $162,000 54,000 27,000 21,600 54,000 27,000 18,900 108,000 Design review Recalls Reinspection Materials inspection Quality training Process acceptance Scrap Lost sales Product inspection Returned goods 16,200 51,300 Required: Prepare a quality cost report. 1. Prepare a graph (pie chart or bar graph) that shows the relative distribution of quality costs and comment on...
Most questions answered within 3 hours.
-
Kylie is a single mom with two dependent children,
Tanner, age 7 and Olivia, age 11....
asked 53 minutes ago -
Phosphorous + bromine = phosphorous tribromide. If 35.0 g of
bromine are reacted and 27.9 grams...
asked 2 hours ago -
Derive the long wavelength limit of the Planck energy density
distribution
asked 2 hours ago -
Calculate the pH of each of the following solutions.
0.50 M HBr
3.1×10⁻⁴ M KOH
4.2×10⁻⁵...
asked 5 hours ago -
For the year ended December 31, Depot Max’s cost of merchandise
sold was $85,600. Inventory at the...
asked 5 hours ago -
Week 10 - Professional Memo Assignment
Professional Memo Assignment
Your mission for this week, should you...
asked 5 hours ago -
Write a Python program that stores the data for each
player on the team, and it...
asked 6 hours ago -
In
the last 3 months, mike never knows when he is going to get his
allowance...
asked 6 hours ago -
Is Ca(OH)2 a Bronsted base, Lewis base, or both? Why?
asked 6 hours ago -
1A- Why don’t voters complain about U.S. tariffs on imported
sugar?
Because sugar is only a...
asked 6 hours ago -
Cash Payback Period
Primera Banco is evaluating two capital investment proposals for
a drive-up ATM kiosk,...
asked 6 hours ago -
Create a button in Swift (Xcode) that will create a charge,
create a charge using Stripe's...
asked 6 hours ago