
Homework Answers
2) Given that,
Y = X^2 + (2.Z)
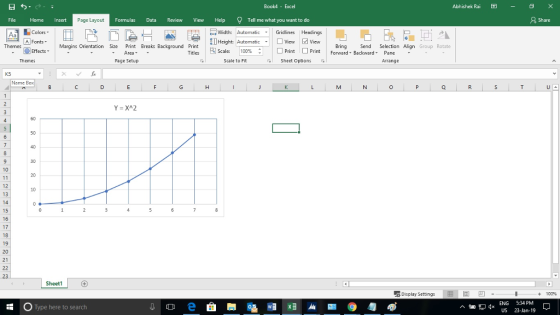
A) For Z = 0,
Y = X^2
Table will be as mentioned below-
| X | Y |
| 0 | 0 |
| 1 | 1 |
| 2 | 4 |
| 3 | 9 |
| 4 | 16 |
| 5 | 25 |
| 6 | 36 |
| 7 | 49 |
Graph will be as mentioned below-
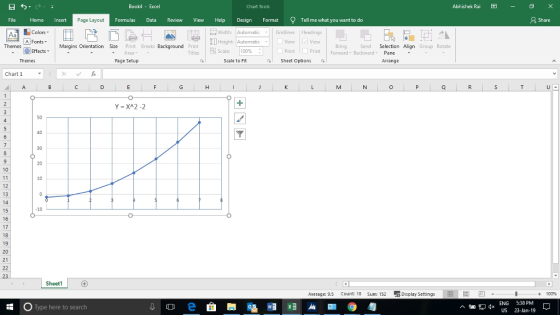
For Z = -1
Y = X^2 - 2
Table will be as mentioned below -
| X | Y |
| 0 | -2 |
| 1 | -1 |
| 2 | 2 |
| 3 | 7 |
| 4 | 14 |
| 5 | 23 |
| 6 | 34 |
| 7 | 47 |
Graph will be as mentioned below -
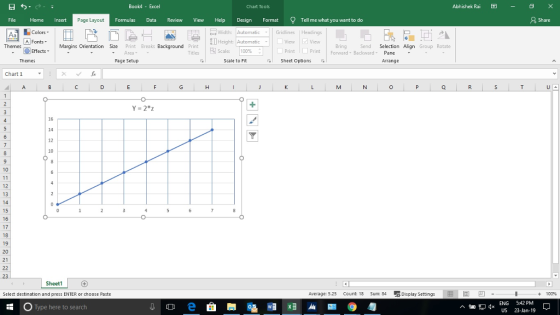
B)
For X =0,
Y = 2*Z
Table will be as mentioned below -
| Z | Y |
| 0 | 0 |
| 1 | 2 |
| 2 | 4 |
| 3 | 6 |
| 4 | 8 |
| 5 | 10 |
| 6 | 12 |
| 7 | 14 |
Graph will be as mentioned below -
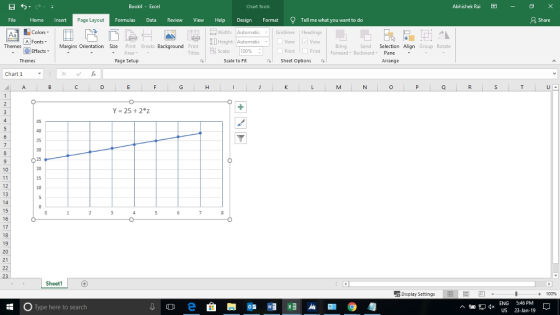
For X = -5
Y = 25 + 2*Z
Table will be as mentioned below -
| Z | Y |
| 0 | 25 |
| 1 | 27 |
| 2 | 29 |
| 3 | 31 |
| 4 | 33 |
| 5 | 35 |
| 6 | 37 |
| 7 | 39 |
Graph will be as mentioned below -
C)
Suppose that Z has value equal to 0. Table will be as mentioned below -
| X | Y | Change % |
| -5 | 25 | 100% |
| -4 | 16 | 64% |
| -3 | 9 | 36% |
| -2 | 4 | 16% |
| -1 | 1 | 4% |
| 0 | 0 | 0% |
| 1 | 1 | 4% |
| 2 | 4 | 16% |
| 3 | 9 | 36% |
| 4 | 16 | 64% |
| 5 | 25 | 100% |
Add Answer to:
2, It is known that the quantitative relationship between the dependent variable Y and the independent...
2, It is known that the quantitative relationship between the dependent variable Y and the independent...
 2, It is known that the quantitative relationship between the dependent variable Y and the independent variables X and 2 is: A. Make a Table and draw the graph of the relationship between Y and X when the numerical value of Z is: B. Make a Table and draw the graph of the relationship between Y and Z when the numerical value of X is: C. Make a Table of the value of the rate of change of Y with...
37 tt ts known that the vartable Y and e quanticative relationship between the dependent 2....
 37 tt ts known that the vartable Y and e quanticative relationship between the dependent 2. the independent variables X ane z is A Nake a Table and draw the graph of the relationshdp betveem Y and x when the numerical value of Z is: B. Make a Table and draw the graph of the relationship betveen Y and 2 when the numerical value of x is: b. Х-+10. 2, It is known that the quantitative relationship between the dependent...
The following information regarding a dependent variable (Y in $1000) and an independent variable (X) is...
 The following information
regarding a dependent variable (Y in $1000) and an independent
variable (X) is provided.
Y
Dependent Variable
15
17
23
17
I. The least-squares estimate of the slope
equals:
II. The least-squares estimate of the intercept
equals:
III. If the independent variable increases by 2
units, the dependent variable is expected to
a. decrease by $300
b. decrease by $3000
c. decrease by $3
d. decrease by $2
e. none of the above
The letter corresponding...
The following information
regarding a dependent variable (Y in $1000) and an independent
variable (X) is provided.
Y
Dependent Variable
15
17
23
17
I. The least-squares estimate of the slope
equals:
II. The least-squares estimate of the intercept
equals:
III. If the independent variable increases by 2
units, the dependent variable is expected to
a. decrease by $300
b. decrease by $3000
c. decrease by $3
d. decrease by $2
e. none of the above
The letter corresponding...
The following information regarding a dependent variable (Y in $1000) and an independent variable (X) is...
 The following information regarding a dependent variable (Y in
$1000) and an independent variable (X) is provided.
Y
Dependent Variable
15
17
23
17
I. The least-squares estimate of the slope
equals:
II. The least-squares estimate of the intercept
equals:
III. If the independent variable increases by 2
units, the dependent variable is expected to
a. decrease by $300
b. decrease by $3000
c. decrease by $3
d. decrease by $2
e. none of the above
The letter corresponding...
The following information regarding a dependent variable (Y in
$1000) and an independent variable (X) is provided.
Y
Dependent Variable
15
17
23
17
I. The least-squares estimate of the slope
equals:
II. The least-squares estimate of the intercept
equals:
III. If the independent variable increases by 2
units, the dependent variable is expected to
a. decrease by $300
b. decrease by $3000
c. decrease by $3
d. decrease by $2
e. none of the above
The letter corresponding...
In controlled comparison research, the observed relationship between an independent variable (X) and a dependent variable...
In controlled comparison research, the observed relationship between an independent variable (X) and a dependent variable (Y) may be caused by some other, uncontrolled compositional difference (Z). So, we always ask, “How else, besides the independent variable, are the groups I am comparing not the same?” For the hypothesis below, do the following: (i) Think up a plausible alternative causal variable. (ii) Describe how this variable might affect the relationship between the independent variable and the dependent variable. In a...
The equation of the regression line between two variables x (independent variable) and y (dependent variable)...
The equation of the regression line between two variables x (independent variable) and y (dependent variable) is given by y-hat = -3x + 2; and the correlation coefficient is r = -.95. The possible x-values range from 1 to 10. Which of the following statements are correct? I. The variable y is strongly positive correlated to the variable x. II. The variable y is strongly negative correlated to the variable x. III. If x = 5, one would predict that...
A study was conducted to examine the relationship between variable X (independent variable) and Y (dependent...
 A study was conducted to examine the relationship between variable X (independent variable) and Y (dependent variable). The Excel output is given in the "Graphs Document". A data point in the above regression is (x,y) = (191,382). What is the residual of this data point? O 72.36 70.33 o o 0-69.75 O 81.25 O None of the options t Intercept X variable Coefficients 95.84 1.13 Standard Error 116.65 0.132 Stat 0.821 8.547 P-value 0.418 0.0000005
Regression analysis (also known as predictive analytics) attempts to establish: multicollinearity linearity in the relationship between...
Regression analysis (also known as predictive analytics) attempts to establish: multicollinearity linearity in the relationship between independent variables multiobjectivity a mathematical relationship between a dependent variable, for which future values will be forecast, and one or more independent variables with known values linearity in the relationship between a dependent variable and a set of independent variables
When the effect of a control variable is examined: a. the relationship between the independent and...
When the effect of a control variable is examined: a. the relationship between the independent and dependent variables may be stronger. b. the relationship between the independent and dependent variables may be weaker. c. the relationship between the independent and dependent variables may be unchanged. d. all of the above
We want to investigate the causal relationship between the dependent variable Y and independent variable x....
We want to investigate the causal relationship between the dependent variable Y and independent variable x. X Y 1 2 2 2 3 4 4 4 5 8 A) Calculate the ?0 hat and ?1 hat (show the steps) B) Calculate SSE, S2, and S C) Calculate the t-statistics for ?1 hat
 2, It is known that the quantitative relationship between the dependent variable Y and the independent variables X and 2 is: A. Make a Table and draw the graph of the relationship between Y and X when the numerical value of Z is: B. Make a Table and draw the graph of the relationship between Y and Z when the numerical value of X is: C. Make a Table of the value of the rate of change of Y with...
 37 tt ts known that the vartable Y and e quanticative relationship between the dependent 2. the independent variables X ane z is A Nake a Table and draw the graph of the relationshdp betveem Y and x when the numerical value of Z is: B. Make a Table and draw the graph of the relationship betveen Y and 2 when the numerical value of x is: b. Х-+10. 2, It is known that the quantitative relationship between the dependent...
 The following information
regarding a dependent variable (Y in $1000) and an independent
variable (X) is provided.
Y
Dependent Variable
15
17
23
17
I. The least-squares estimate of the slope
equals:
II. The least-squares estimate of the intercept
equals:
III. If the independent variable increases by 2
units, the dependent variable is expected to
a. decrease by $300
b. decrease by $3000
c. decrease by $3
d. decrease by $2
e. none of the above
The letter corresponding...
The following information
regarding a dependent variable (Y in $1000) and an independent
variable (X) is provided.
Y
Dependent Variable
15
17
23
17
I. The least-squares estimate of the slope
equals:
II. The least-squares estimate of the intercept
equals:
III. If the independent variable increases by 2
units, the dependent variable is expected to
a. decrease by $300
b. decrease by $3000
c. decrease by $3
d. decrease by $2
e. none of the above
The letter corresponding...
 The following information regarding a dependent variable (Y in
$1000) and an independent variable (X) is provided.
Y
Dependent Variable
15
17
23
17
I. The least-squares estimate of the slope
equals:
II. The least-squares estimate of the intercept
equals:
III. If the independent variable increases by 2
units, the dependent variable is expected to
a. decrease by $300
b. decrease by $3000
c. decrease by $3
d. decrease by $2
e. none of the above
The letter corresponding...
The following information regarding a dependent variable (Y in
$1000) and an independent variable (X) is provided.
Y
Dependent Variable
15
17
23
17
I. The least-squares estimate of the slope
equals:
II. The least-squares estimate of the intercept
equals:
III. If the independent variable increases by 2
units, the dependent variable is expected to
a. decrease by $300
b. decrease by $3000
c. decrease by $3
d. decrease by $2
e. none of the above
The letter corresponding...
 A study was conducted to examine the relationship between variable X (independent variable) and Y (dependent variable). The Excel output is given in the "Graphs Document". A data point in the above regression is (x,y) = (191,382). What is the residual of this data point? O 72.36 70.33 o o 0-69.75 O 81.25 O None of the options t Intercept X variable Coefficients 95.84 1.13 Standard Error 116.65 0.132 Stat 0.821 8.547 P-value 0.418 0.0000005
Most questions answered within 3 hours.
-
An MNE is this kind of industry when competition in one country
is essentially independent of...
asked 1 hour ago -
. For this set of questions, determine what
proportion of a normal distribution is located betweeneach...
asked 1 hour ago -
A college student is employed as a door-to-door newspaper
salesman. Historical data suggests that the student...
asked 2 hours ago -
MATLAB HW 11 problem using Switch Case and Input commands
Write a script file that calculates...
asked 2 hours ago -
Considering gravitational time dilation, calculate the time that
passes in Earth’s surface while 1 hour passes...
asked 2 hours ago -
Minitab Problem: Take the Lake Hume June rainfall data and find
use the processes outlined in...
asked 3 hours ago -
X Company is trying to decide whether to continue using old
equipment to make Product A...
asked 3 hours ago -
IN PYTHON ONLY !! Program 2: Re-work
program #5 (WeeklyHours) from the previous assignment such that...
asked 4 hours ago -
The average length of time between arrivals at a turnpike
toll-booth is 26 seconds. What is...
asked 6 hours ago -
(a) A piston at 6.1 atm contains a gas that occupies a volume of
3.5 L....
asked 7 hours ago -
Please answer true or false. Words
cannot be changed or added in to make it true...
asked 7 hours ago -
An empty test tube weighs 15.923 grams. Then,
MgCl2•6H2O is added into the test tube. After...
asked 7 hours ago