Forty-two cities provided information on vacancy rates (in percent) for local apartments in the following frequency...
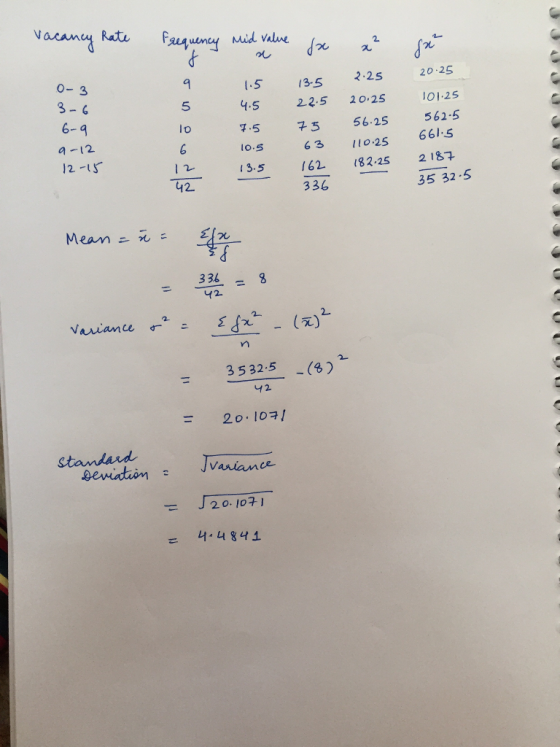
Forty-two cities provided information on vacancy rates (in percent) for local apartments in the following frequency distribution.
| Vacancy Rate (in percent) | Frequency |
| 0 up to 3 | 9 |
| 3 up to 6 | 5 |
| 6 up to 9 | 10 |
| 9 up to 12 | 6 |
| 12 up to 15 | 12 |
b. Calculate the variance and the standard deviation for this sample. (Round intermediate calculations to at least 4 decimal places and final answers to 2 decimal places.)
Homework Answers
This is the case of grouped data . Variance is calculated In the following manner-
Add Answer to:
Forty-two cities provided information on vacancy rates (in
percent) for local apartments in the following frequency...
Twenty-nine cities provided information on vacancy rates (in percent) for local apartments in the following frequency...
Twenty-nine cities provided information on vacancy rates (in percent) for local apartments in the following frequency distribution. Vacancy Rate (in percent) Frequency 0 up to 3 7 3 up to 6 4 6 up to 9 8 9 up to 12 5 12 up to 15 5 b. Calculate the variance and the standard deviation for this sample. (Round intermediate calculations to at least 4 decimal places and final answers to 2 decimal places.) 2 decimal spaces required* Variance: Standard...
Seventy-seven cities provided information on vacancy rates (in percent) for local apartments in the following frequency...
 Seventy-seven cities provided information on vacancy rates (in percent) for local apartments in the following frequency distribution. 0 up to 3 3 up to 6 6 up to 9 9 up to 12 12 up to 15 12 13 25 16 a. Calculate the average vacancy rate. (Round your answer to 2 decimal places.) Average vacancy rate b. Calculate the variance and the standard deviation for this sample. (Round intermediate calculations to at least 4 decimal places and final answers...
Thirty-nine cities provided information on vacancy rates (in percent) in local apartments in the following frequency...
Thirty-nine cities provided information on vacancy rates (in percent) in local apartments in the following frequency distribution. Vacancy Rate (in percent) Frequency 0 up to 3 7 3 up to 6 4 6 up to 9 9 9 up to 12 6 12 up to 15 13 a. Calculate the average vacancy rate. (Round your answer to 2 decimal places.) Average vacancy rate b. Calculate the variance and the standard deviation for this sample....
Return to ques Seventy-seven cities provided intormation on vacancy rates (in percent) tor local apartments in...
 Return to ques Seventy-seven cities provided intormation on vacancy rates (in percent) tor local apartments in the tollowing trequency distribution. Vacaney Rate (in percent)Frequeney 0 up to3 3 up to 6 6 up to9 9 up to 12 12 up to 15 12 13 25 16 a. Calculate the average vacancy rate. (Round your answer to 2 decimal places.) Answer is complete and correct. Average vacancy rate 8.40 b. Calculate the variance and the standard deviation for this sample. (Round...
The historical returns on a portfolio had an average return of 21 percent and a standard...
The historical returns on a portfolio had an average return of 21 percent and a standard deviation of 29 percent. Assume that returns on this portfolio follow a bell-shaped distribution. a. Approximately what percentage of returns were greater than 79 percent? (Round your answer to the nearest whole percent.) b. Approximately what percentage of returns were below –66 percent? (Round your answer to 1 decimal place.) ____________________________________________________________________________________________________________________________ The following relative frequency distribution was constructed from a population of 400. Calculate...
Consider a sample with 10 observations of 11, –3, 8, 8, 10, 1, –2, 13, 8,...
Consider a sample with 10 observations of 11, –3, 8, 8, 10, 1, –2, 13, 8, and –4. Use z-scores to determine if there are any outliers in the data; assume a bell-shaped distribution. (Round your answers to 2 decimal places. Negative values should be indicated by a minus sign.) The z-score for the smallest observation The z-score for the largest observation There are outliers or no outliers in the data. The historical returns on a portfolio had...
Chapter 12 Homework instructions | help Question 7 (of 7) Save & Exit Submit 7.value: 10.00...
Chapter 12 Homework instructions | help Question 7 (of 7) Save & Exit Submit 7.value: 10.00 points Exercise 12-29 Algo Seventy four cities provided information on vacancy rates (in percent) in local apartments in the following frequency distribution. The sample mean and the sample standard deviation are 10% and 3.6%, respectively. Use Table 3. Vacancy Rate (in percent) Frequency Less than 6 6 6 up to 9 15 9 up to 12 32 12 or more 21 a. Choose the...
The following relative frequency distribution was constructed from a population of 200. Calculate the population mean,...
The following relative frequency distribution was constructed from a population of 200. Calculate the population mean, the population variance, and the population standard deviation. (Negative values should be indicated by a minus sign. Round intermediate calculations to at least 4 decimal places and final answers to 2 decimal places.) Class Relative Frequency −20 up to −10 0.35 −10 up to 0 0.20 0 up to 10 0.40 10 up to 20 0.05 pop mean = pop variance= pop standard deviation=
The following relative frequency distribution was constructed from a population of 300. Calculate the population mean,...
The following relative frequency distribution was constructed from a population of 300. Calculate the population mean, the population variance, and the population standard deviation. (Negative values should be indicated by a minus sign. Round intermediate calculations to at least 4 decimal places and final answers to 2 decimal places.) Class Relative Frequency −20 up to −10 0.08 −10 up to 0 0.22 0 up to 10 0.38 10 up to 20 0.32 Population mean Population variance Population standard deviation
 Seventy-seven cities provided information on vacancy rates (in percent) for local apartments in the following frequency distribution. 0 up to 3 3 up to 6 6 up to 9 9 up to 12 12 up to 15 12 13 25 16 a. Calculate the average vacancy rate. (Round your answer to 2 decimal places.) Average vacancy rate b. Calculate the variance and the standard deviation for this sample. (Round intermediate calculations to at least 4 decimal places and final answers...
 Return to ques Seventy-seven cities provided intormation on vacancy rates (in percent) tor local apartments in the tollowing trequency distribution. Vacaney Rate (in percent)Frequeney 0 up to3 3 up to 6 6 up to9 9 up to 12 12 up to 15 12 13 25 16 a. Calculate the average vacancy rate. (Round your answer to 2 decimal places.) Answer is complete and correct. Average vacancy rate 8.40 b. Calculate the variance and the standard deviation for this sample. (Round...
Most questions answered within 3 hours.
-
A firm operating in a purely competitive environment is faced
with a market price of $250....
asked 2 minutes ago -
•Let’s say someone claims the average population size is
600 feet squared and the housing authority...
asked 9 minutes ago -
Cynaide is a deadly poison that blocks the last step in the
electron transport chain of...
asked 13 minutes ago -
Your friend tells you that there is a vending machine on campus
that dispenses M&M packs...
asked 29 minutes ago -
What advantages are there to using piperidine rather than
hydroxide as a base?
asked 27 minutes ago -
7. The life of a Freeze Breeze electric fan is normally
distributed with a mean 4...
asked 30 minutes ago -
1. A 751 mL NaCl solution is diluted to a volume of 1.06 L and a...
asked 35 minutes ago -
8
A $20,000 face value STRIPS is currently quoted at 38.642 and
has 8 years to...
asked 35 minutes ago -
The current exchange rate between the Japanese yen and
the US dollar is 120 yen per...
asked 37 minutes ago -
Marla’s Massages and More bought a special massage table two
years ago for $9,300. At the...
asked 44 minutes ago -
Suppose you require a peak output voltage of 15.0 V and have
available an AC source...
asked 45 minutes ago -
We
conduct A study to estimate the mean age of the population of women
at the...
asked 56 minutes ago