
Homework Answers
a. 
b. The scatterplot shows almost all points lying on a line with negative slope. This indicates a strong negative linear relationship between the variables Long jump and Sprint Time.
c. For the regression
Long jump=alpha+beta *Sprint time+error,
we get the estimates
beta_hat=rSD(Long jump)/SD(Sprint Time)=Cov(Long Jump,Sprint Time)/Var(Sprint Time)=-42.84519/1.550747=-27.629
alpha_hat= Mean(Long jump)-beta_hat*Mean(Sprint time)=118.3846+27.629*6.738462=304.560,
Thus the regression equation is
Long jump_hat=304.560-27.629 *Sprint time
The correlation coefficient between the variables, r= Cov(Long Jump,Sprint Time)/(SD(Sprint time)*SD(Long Jump))=-42.84519/( 1.24529* 46.05529)= -0.7470541
R^2=r^2= 0.5581
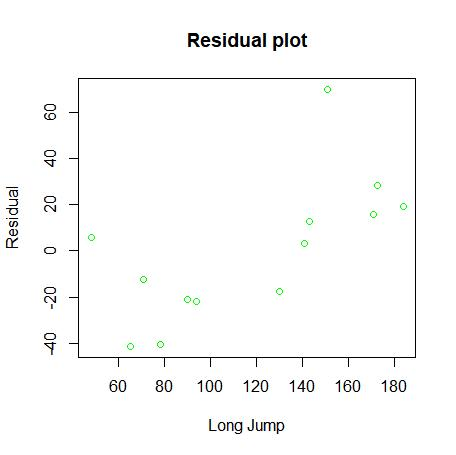
r is quite close to -1, indicating strong negative association between the variables. However R^2 is only 55.81%, which indicates only 55.81% variation in data is explained by the regression. Possibly there are some outliers decreasing the accuracy of the regression.
d) 
Add Answer to:
b) The tndents wh take erte run the print typicol lbe there hegatul havp sharter iwm...
0. The table below shows data for 13 students in a statistics class. Each member of...
 0. The table below shows data for 13 students in a statistics class. Each member of the class ran a 40-yard sprin and then did a long iump (with a running start). Sprint Time (s) 5.41 5.05 9.49 8.09 7.01 7.17 6.83 6.73 8.01 5.68 5.78 6.31 6.04 Long Jump (in) 171 184 48 151 90 65 94 78 71 130 173 143 141 a) Create and label a scatterplot of the data (Sprint time vs Long Jump) b) Describe...
 0. The table below shows data for 13 students in a statistics class. Each member of the class ran a 40-yard sprin and then did a long iump (with a running start). Sprint Time (s) 5.41 5.05 9.49 8.09 7.01 7.17 6.83 6.73 8.01 5.68 5.78 6.31 6.04 Long Jump (in) 171 184 48 151 90 65 94 78 71 130 173 143 141 a) Create and label a scatterplot of the data (Sprint time vs Long Jump) b) Describe...
Most questions answered within 3 hours.
-
Calculate the approximate number of residues of Rubisco, which
is involved in carbon fixation in plants,...
asked 13 minutes ago -
Other decisions about scientific claims can have a much broader
impact.ENERGYarrow-10x10.png, environment, health, security - all...
asked 1 hour ago -
I need to write a research paper and work cited about this
topic: The United States...
asked 1 hour ago -
Hello! I was wondering if I could have some help?
If the vapor pressure of carvone...
asked 1 hour ago -
An economist wants to estimate the mean per capita income (in
thousands of dollars) for a...
asked 2 hours ago -
What would be the input/output characteristic of a circuit
obtained by putting two of your 2's-complementers...
asked 2 hours ago -
In Drosophila, the transition from the syncytial blastoderm
stage to the cellular blastoderm stage is a...
asked 2 hours ago -
Project management question:
Name 3 different types of resources (hint: humans are one
type)
asked 2 hours ago -
Consider the following reaction: C 2H 2( g) + 2H 2( g) C 2H 6(
g)...
asked 2 hours ago -
Consider a 1.0 L buffer containing 0.092 mol L-1 HCOOH and 0.100
mol L-1 HCOO-. What...
asked 3 hours ago -
Koch Realty has owned a vacant land with a FMV of
$775,000 and an adjusted basis...
asked 3 hours ago -
It is estimated 29% of all adults in United States invest in
stocks and that 85%...
asked 3 hours ago