 Problem 2
On the following page, I have attached PG Company’s Consolidated Statements of Earnings for the 3 fiscal year’s ending June 30, 2019.
Required:Using the attached earnings statement, for each period presented,
- Compute the gross margin %
Note: Gross margin % = [(Net sales – Cost of products sold)/Net sales] x 100
- Compute the net profit margin on sales %
Note: Net profit margin % = (Net earnings attributable to PG/Net sales) x 100
- Considering the 3-year trend for a. and b. above, provide a brief comment about the company’s performance for:
- Gross margin % and
- Net profit margin %.
Homework Answers
| gross margin | (net sales - cost of sales)/net sales * 100 | ||
| 2019 ($ millions) | 2018 ($ millions) | 2017 ($ millions) | |
| net sales | 67684 | 66832 | 65058 |
| cost of sales | 34768 | 34432 | 32638 |
| gross margin | 48.63% | 48.48% | 49.83% |
Gross margin has declined has declined marginally from 49.83% in 2017 to 48.63% in 2019. The primary reason being increase in cost of sales which could not of set the growth in sales.
| net profit margin | net earnings attributable to PG / net sales *100 | ||
| 2019 ($ millions) | 2018 ($ millions) | 2017 ($ millions) | |
| net earnings attributable to PG | 3897 | 9750 | 15326 |
| net sales | 67684 | 66832 | 65058 |
| net profit margin | 5.76% | 14.59% | 23.56% |
Net profit margin has declined very significantly from 23.56% in 2017 to 5.76% 2019. The reason being impairment charges of $8345 million recored only in 2019.
Add Answer to:
Problem 2
On the following page, I have attached PG Company’s Consolidated
Statements of Earnings for...
2019 $ 67,684 34,768 19,084 8,345 5,487 509 220 871 Below is a financial statement of...
 2019 $ 67,684 34,768 19,084 8,345 5,487 509 220 871 Below is a financial statement of Procter and Gamble: Amounts in millions except per share amounts; Years ended June 30 NET SALES Cost of products sold Selling, general and administrative expense Goodwill and indefinite lived intangibles impairment charges OPERATING INCOME Interest expense Interest income Other non-operating income/(expense), net EARNINGS FROM CONTINUING OPERATIONS BEFORE INCOME TAXES Income taxes on continuing operations NET EARNINGS FROM CONTINUING OPERATIONS NET EARNINGS FROM DISCONTINUED OPERATIONS...
Compute P&G's gross profit for each of the years 2015-2017. Explain why gross profit decreased in...
 Compute P&G's gross profit for each of the years 2015-2017.
Explain why gross profit decreased in 2017.
What are P&G's primary revenue sources
B-2 APPENDIX B Specimen Financial Statements: The Procter & Gamble Company 2017 $ 65,058 32,535 18,568 2016 2015 $ 65,299 $ 70,749 32,909 37,056 18,949 20,616 2,028 11,049 1395 Consolidated Statements of Earnings Amounts in millions except per share amounts: Years ended June 30 NET SALES Cost of products sold Selling, general and administrative expense Venezuela deconsolidation...
Compute P&G's gross profit for each of the years 2015-2017.
Explain why gross profit decreased in 2017.
What are P&G's primary revenue sources
B-2 APPENDIX B Specimen Financial Statements: The Procter & Gamble Company 2017 $ 65,058 32,535 18,568 2016 2015 $ 65,299 $ 70,749 32,909 37,056 18,949 20,616 2,028 11,049 1395 Consolidated Statements of Earnings Amounts in millions except per share amounts: Years ended June 30 NET SALES Cost of products sold Selling, general and administrative expense Venezuela deconsolidation...
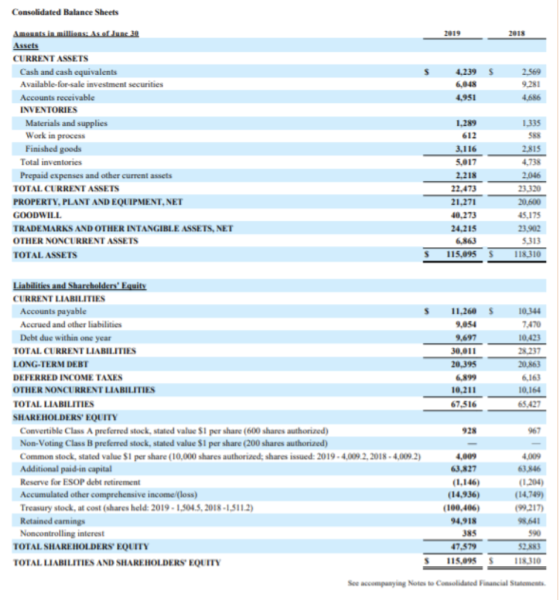
Calculate the company's debt to total assets ratio (also called total debt ratio) for both the...
 Calculate the company's debt to total assets ratio (also called total debt ratio) for both the recent year and the prior year. Show your computations. Write the textbook formula here: Recent year: Prior year: Explain what information this ratio provides (define), and what the results mean to this company. Use complete sentences and your own words. Compare the two, has the ratio improved? The Procter& Gamble Company 37 Consolidated Statements of Earnings 2018 2017 2016 NET SALES S 66,832 S...
212,482 Consolidated Balance Sheets - USD $ $ In Mill 2 Current Assets Cash and cash...
 212,482 Consolidated Balance Sheets - USD $ $ In Mill 2 Current Assets Cash and cash equivalents Martable securities Note 4) Accounts and notes receivable et of lowance of $278 for 2017 id $212 for 2016) Inventaries Note 6) Equipment on operating l o te 7) 8 Other current N ote 4 Note 12 at VE 9. Current held for sale Note 3) 10 Total currentes 11 Non-current Assets 12 Equity in news of nonconsolidated affiliates Note 8) 13 Property,...
3. Using the attached excerpts from Coca Cola's 2018 Annual Report (financial statements and Note 8:...
 3. Using the attached excerpts from Coca Cola's 2018 Annual Report (financial statements and Note 8: Property, Plant, and Equipment) answer the following questions. In addition: - All numbers are in Smillions (except per share data). - Provide calculations when necessary. a. Long-term Assets i) ii) iii) What is the total value of Coca Cola's long-term assets as of December 31, 2018? What is the net book value (NBV) of Coca Cola's property, plant and equipment as of December 31,...
Please follow the report and answer the following question. show work Consolidated Statements of Earnings $...
 Please follow the report and answer the following question.
show work
Consolidated Statements of Earnings $ $ in milions excent per common share amounts) Revenue Cost of products sold Gross margin 2019 145,534 138,700 6,834 2018 2010 136,809 $ 129,628 7,181 2017 129,976 123,432 6 ,544 3.775 Operating expenses: Distribution, selling, general and administrative expenses Restructuring and employee severance Amortization and other acquisition-related costs Impairments and gain loss on disposal of assets, net Litigation (recoveries)/charges, net Operating earnings 4.480 125...
Please follow the report and answer the following question.
show work
Consolidated Statements of Earnings $ $ in milions excent per common share amounts) Revenue Cost of products sold Gross margin 2019 145,534 138,700 6,834 2018 2010 136,809 $ 129,628 7,181 2017 129,976 123,432 6 ,544 3.775 Operating expenses: Distribution, selling, general and administrative expenses Restructuring and employee severance Amortization and other acquisition-related costs Impairments and gain loss on disposal of assets, net Litigation (recoveries)/charges, net Operating earnings 4.480 125...
ratios for consolidated balance sheet Starbucks how do i solve for the ratio template? Consolidated Statements...
 ratios for consolidated balance sheet Starbucks
how
do i solve for the ratio template?
Consolidated Statements of Earn Consolidated Balance Sheets Ratios Template Sep 30, 2018 O . 2017 Consolidated Balance Sheets - USD (S) Sin Millions Current Cash and cash equivalents Short-term in Prepaid Expand Other Ass, Cut Equity and cost investments Property, plant and equipment Deferred income Other long-term acts Other intangible assets TOTAL ASSETS Accued liabili Stowalue and liability Current pro long-term de Long-term debe Deed Revenue...
ratios for consolidated balance sheet Starbucks
how
do i solve for the ratio template?
Consolidated Statements of Earn Consolidated Balance Sheets Ratios Template Sep 30, 2018 O . 2017 Consolidated Balance Sheets - USD (S) Sin Millions Current Cash and cash equivalents Short-term in Prepaid Expand Other Ass, Cut Equity and cost investments Property, plant and equipment Deferred income Other long-term acts Other intangible assets TOTAL ASSETS Accued liabili Stowalue and liability Current pro long-term de Long-term debe Deed Revenue...
Calculate the following financial ratios for fiscal year 2018 only using the "Consolidated Statements of Earn"...
 Calculate the following financial ratios for fiscal year 2018
only using the "Consolidated Statements of Earn" and "Consolidated
Balance Sheets" worksheets in Starbucks 2017 and 2018 Annual
Financial Statements : Current Ratio, Cash Ratio, Inventory
Turnover, Days Sales in Inventory, Long Term Debt Ratio, Times
Interest Earned, Gross Profit Margin, Net Profit Margin, Return on
Equity, Return on Assets.
12 Months Ended Oct. 01, 2017 Sep. 30, 2018 Oct. 02, 2016 $ 22,386.8 9,034,3 6,493.3 500.3 1,011.4 1,450.7 153.5 18,643.5...
Calculate the following financial ratios for fiscal year 2018
only using the "Consolidated Statements of Earn" and "Consolidated
Balance Sheets" worksheets in Starbucks 2017 and 2018 Annual
Financial Statements : Current Ratio, Cash Ratio, Inventory
Turnover, Days Sales in Inventory, Long Term Debt Ratio, Times
Interest Earned, Gross Profit Margin, Net Profit Margin, Return on
Equity, Return on Assets.
12 Months Ended Oct. 01, 2017 Sep. 30, 2018 Oct. 02, 2016 $ 22,386.8 9,034,3 6,493.3 500.3 1,011.4 1,450.7 153.5 18,643.5...
Calculate the following financial ratios for fiscal year 2018 only using the "Consolidated Statements of Earn"...
 Calculate the following financial ratios for fiscal year 2018
only using the "Consolidated Statements of Earn" and "Consolidated
Balance Sheets" worksheets in Starbucks 2017 and 2018 Annual
Financial Statements: Current Ratio, Cash Ratio, Inventory
Turnover, Days Sales in Inventory, Long Term Debt Ratio, Times
Interest Earned, Gross Profit Margin, Net Profit Margin, Return on
Equity, Return on Assets.
12 Months Ended Oct. 01, 2017 Sep. 30, 2018 Oct. 02, 2016 $ 22,386.8 9,034,3 6,493.3 500.3 1,011.4 1,450.7 153.5 18,643.5 $...
Calculate the following financial ratios for fiscal year 2018
only using the "Consolidated Statements of Earn" and "Consolidated
Balance Sheets" worksheets in Starbucks 2017 and 2018 Annual
Financial Statements: Current Ratio, Cash Ratio, Inventory
Turnover, Days Sales in Inventory, Long Term Debt Ratio, Times
Interest Earned, Gross Profit Margin, Net Profit Margin, Return on
Equity, Return on Assets.
12 Months Ended Oct. 01, 2017 Sep. 30, 2018 Oct. 02, 2016 $ 22,386.8 9,034,3 6,493.3 500.3 1,011.4 1,450.7 153.5 18,643.5 $...
 2019 $ 67,684 34,768 19,084 8,345 5,487 509 220 871 Below is a financial statement of Procter and Gamble: Amounts in millions except per share amounts; Years ended June 30 NET SALES Cost of products sold Selling, general and administrative expense Goodwill and indefinite lived intangibles impairment charges OPERATING INCOME Interest expense Interest income Other non-operating income/(expense), net EARNINGS FROM CONTINUING OPERATIONS BEFORE INCOME TAXES Income taxes on continuing operations NET EARNINGS FROM CONTINUING OPERATIONS NET EARNINGS FROM DISCONTINUED OPERATIONS...
 Compute P&G's gross profit for each of the years 2015-2017.
Explain why gross profit decreased in 2017.
What are P&G's primary revenue sources
B-2 APPENDIX B Specimen Financial Statements: The Procter & Gamble Company 2017 $ 65,058 32,535 18,568 2016 2015 $ 65,299 $ 70,749 32,909 37,056 18,949 20,616 2,028 11,049 1395 Consolidated Statements of Earnings Amounts in millions except per share amounts: Years ended June 30 NET SALES Cost of products sold Selling, general and administrative expense Venezuela deconsolidation...
Compute P&G's gross profit for each of the years 2015-2017.
Explain why gross profit decreased in 2017.
What are P&G's primary revenue sources
B-2 APPENDIX B Specimen Financial Statements: The Procter & Gamble Company 2017 $ 65,058 32,535 18,568 2016 2015 $ 65,299 $ 70,749 32,909 37,056 18,949 20,616 2,028 11,049 1395 Consolidated Statements of Earnings Amounts in millions except per share amounts: Years ended June 30 NET SALES Cost of products sold Selling, general and administrative expense Venezuela deconsolidation...
 Calculate the company's debt to total assets ratio (also called total debt ratio) for both the recent year and the prior year. Show your computations. Write the textbook formula here: Recent year: Prior year: Explain what information this ratio provides (define), and what the results mean to this company. Use complete sentences and your own words. Compare the two, has the ratio improved? The Procter& Gamble Company 37 Consolidated Statements of Earnings 2018 2017 2016 NET SALES S 66,832 S...
 212,482 Consolidated Balance Sheets - USD $ $ In Mill 2 Current Assets Cash and cash equivalents Martable securities Note 4) Accounts and notes receivable et of lowance of $278 for 2017 id $212 for 2016) Inventaries Note 6) Equipment on operating l o te 7) 8 Other current N ote 4 Note 12 at VE 9. Current held for sale Note 3) 10 Total currentes 11 Non-current Assets 12 Equity in news of nonconsolidated affiliates Note 8) 13 Property,...
 3. Using the attached excerpts from Coca Cola's 2018 Annual Report (financial statements and Note 8: Property, Plant, and Equipment) answer the following questions. In addition: - All numbers are in Smillions (except per share data). - Provide calculations when necessary. a. Long-term Assets i) ii) iii) What is the total value of Coca Cola's long-term assets as of December 31, 2018? What is the net book value (NBV) of Coca Cola's property, plant and equipment as of December 31,...
 Please follow the report and answer the following question.
show work
Consolidated Statements of Earnings $ $ in milions excent per common share amounts) Revenue Cost of products sold Gross margin 2019 145,534 138,700 6,834 2018 2010 136,809 $ 129,628 7,181 2017 129,976 123,432 6 ,544 3.775 Operating expenses: Distribution, selling, general and administrative expenses Restructuring and employee severance Amortization and other acquisition-related costs Impairments and gain loss on disposal of assets, net Litigation (recoveries)/charges, net Operating earnings 4.480 125...
Please follow the report and answer the following question.
show work
Consolidated Statements of Earnings $ $ in milions excent per common share amounts) Revenue Cost of products sold Gross margin 2019 145,534 138,700 6,834 2018 2010 136,809 $ 129,628 7,181 2017 129,976 123,432 6 ,544 3.775 Operating expenses: Distribution, selling, general and administrative expenses Restructuring and employee severance Amortization and other acquisition-related costs Impairments and gain loss on disposal of assets, net Litigation (recoveries)/charges, net Operating earnings 4.480 125...
 ratios for consolidated balance sheet Starbucks
how
do i solve for the ratio template?
Consolidated Statements of Earn Consolidated Balance Sheets Ratios Template Sep 30, 2018 O . 2017 Consolidated Balance Sheets - USD (S) Sin Millions Current Cash and cash equivalents Short-term in Prepaid Expand Other Ass, Cut Equity and cost investments Property, plant and equipment Deferred income Other long-term acts Other intangible assets TOTAL ASSETS Accued liabili Stowalue and liability Current pro long-term de Long-term debe Deed Revenue...
ratios for consolidated balance sheet Starbucks
how
do i solve for the ratio template?
Consolidated Statements of Earn Consolidated Balance Sheets Ratios Template Sep 30, 2018 O . 2017 Consolidated Balance Sheets - USD (S) Sin Millions Current Cash and cash equivalents Short-term in Prepaid Expand Other Ass, Cut Equity and cost investments Property, plant and equipment Deferred income Other long-term acts Other intangible assets TOTAL ASSETS Accued liabili Stowalue and liability Current pro long-term de Long-term debe Deed Revenue...
 Calculate the following financial ratios for fiscal year 2018
only using the "Consolidated Statements of Earn" and "Consolidated
Balance Sheets" worksheets in Starbucks 2017 and 2018 Annual
Financial Statements : Current Ratio, Cash Ratio, Inventory
Turnover, Days Sales in Inventory, Long Term Debt Ratio, Times
Interest Earned, Gross Profit Margin, Net Profit Margin, Return on
Equity, Return on Assets.
12 Months Ended Oct. 01, 2017 Sep. 30, 2018 Oct. 02, 2016 $ 22,386.8 9,034,3 6,493.3 500.3 1,011.4 1,450.7 153.5 18,643.5...
Calculate the following financial ratios for fiscal year 2018
only using the "Consolidated Statements of Earn" and "Consolidated
Balance Sheets" worksheets in Starbucks 2017 and 2018 Annual
Financial Statements : Current Ratio, Cash Ratio, Inventory
Turnover, Days Sales in Inventory, Long Term Debt Ratio, Times
Interest Earned, Gross Profit Margin, Net Profit Margin, Return on
Equity, Return on Assets.
12 Months Ended Oct. 01, 2017 Sep. 30, 2018 Oct. 02, 2016 $ 22,386.8 9,034,3 6,493.3 500.3 1,011.4 1,450.7 153.5 18,643.5...
 Calculate the following financial ratios for fiscal year 2018
only using the "Consolidated Statements of Earn" and "Consolidated
Balance Sheets" worksheets in Starbucks 2017 and 2018 Annual
Financial Statements: Current Ratio, Cash Ratio, Inventory
Turnover, Days Sales in Inventory, Long Term Debt Ratio, Times
Interest Earned, Gross Profit Margin, Net Profit Margin, Return on
Equity, Return on Assets.
12 Months Ended Oct. 01, 2017 Sep. 30, 2018 Oct. 02, 2016 $ 22,386.8 9,034,3 6,493.3 500.3 1,011.4 1,450.7 153.5 18,643.5 $...
Calculate the following financial ratios for fiscal year 2018
only using the "Consolidated Statements of Earn" and "Consolidated
Balance Sheets" worksheets in Starbucks 2017 and 2018 Annual
Financial Statements: Current Ratio, Cash Ratio, Inventory
Turnover, Days Sales in Inventory, Long Term Debt Ratio, Times
Interest Earned, Gross Profit Margin, Net Profit Margin, Return on
Equity, Return on Assets.
12 Months Ended Oct. 01, 2017 Sep. 30, 2018 Oct. 02, 2016 $ 22,386.8 9,034,3 6,493.3 500.3 1,011.4 1,450.7 153.5 18,643.5 $...
Most questions answered within 3 hours.
-
You measure 22 dogs' weights, and find they have a mean weight
of 64 ounces. Assume...
asked 1 minute from now -
Complete and balance the following methesis reaction in aqueous
solution.
Instructions
• Use proper element capitalization....
asked 9 minutes ago -
Green Tree Corporation is expecting to receive $0.5 million at
the end of Year 1, $0.25...
asked 18 minutes ago -
A face value of $10,000 is assumed for these Treasury bills.
Maturity Days to Maturity Bank...
asked 14 minutes ago -
Please read the article attached.Under Armour Is Subject of
Federal Accounting Probes - WSJ.pdf Under Armour,...
asked 12 minutes ago -
An increase in income will usually shift out the demand for a
product.
Group of answer...
asked 16 minutes ago -
What is the correct unit of the spring constant k?
A- N m
B- J/m
C-...
asked 27 minutes ago -
A manufacturing company prepays its insurance coverage for a
three-year period. The premium for the three...
asked 31 minutes ago -
What is the other name for Shortest Job First Preemptive
Algorithm?
What are the 5 different...
asked 44 minutes ago -
24) An outbreak due to exposure of a group of persons to the
same harmful influence...
asked 53 minutes ago -
Show the calculation of (1) the expected grams of alum
(KAl(SO4)2 •12 H2O) formed from the...
asked 55 minutes ago -
*There are two different answers posted. Other students
were asked the same question. Which response is...
asked 1 hour ago