
Homework Answers

Add Answer to:
Suppose life expectancy in years (1) is a function of two inputs, health expenditures (H) and...
Suppose life expectancy in years (L) is a function of two inputs, health expenditures (H) and...
 Suppose life expectancy in years (L) is a function of two inputs, health expenditures (H) and nutrition expenditures (N) in hundreds of dollars per year. The production function is L-ch0.20 0.80 Beginning with a health input of $400 per year (H = 4) and a nutrition input of $400 per year (N = 4), show that the marginal product of health expenditures and the marginal product of nutrition expenditures are both decreasing. The change in the marginal product of health...
Suppose life expectancy in years (L) is a function of two inputs, health expenditures (H) and...
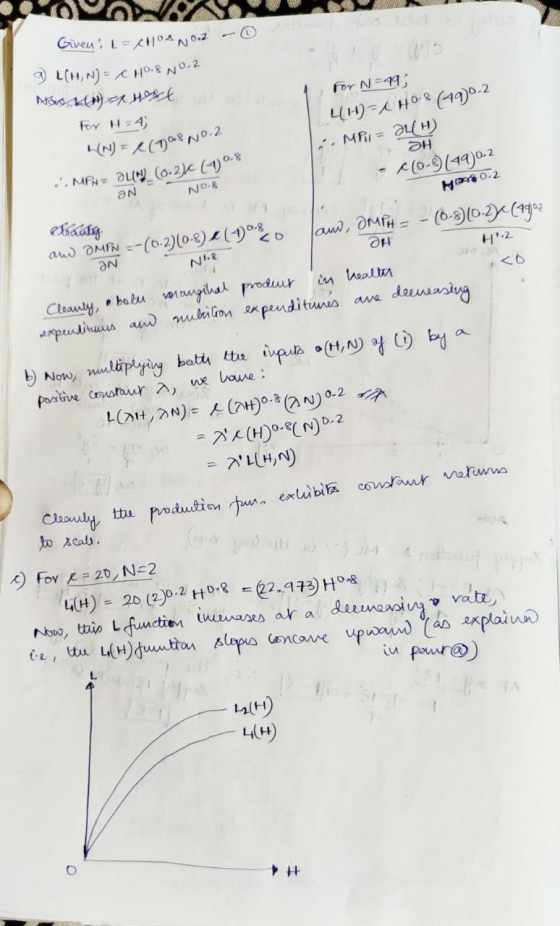
 Suppose life expectancy in years (L) is a function of two inputs, health expenditures (H) and nutrition expenditures (N) in hundreds of dollars per year. The production function is LE CH0.40 0.60 Beginning with c= 1, a health input of $300 per year (H = 3) and a nutrition input of $500 per year (N = 5), show that the marginal product of health expenditures and the marginal product of nutrition expenditures are both decreasing. Life expectancy (L) , The...
Suppose we are graphing the health stock H as a function of medical spending M; where...
 Suppose we are graphing the health stock H as a function of
medical spending M; where the function H = H(M) is increasing at a
decreasing rate (H0 > 0 and H00 < 0): Researchers argue that
the rise of agricultural output increased the height and weight of
humans allowing them to better Öght o§ infectious diseases.
Graphically illustrate how improved technology in agriculture may
have altered the health production function if this theory is
correct.
Suppose we are graphing...
Suppose we are graphing the health stock H as a function of
medical spending M; where the function H = H(M) is increasing at a
decreasing rate (H0 > 0 and H00 < 0): Researchers argue that
the rise of agricultural output increased the height and weight of
humans allowing them to better Öght o§ infectious diseases.
Graphically illustrate how improved technology in agriculture may
have altered the health production function if this theory is
correct.
Suppose we are graphing...
3. Classifying Life Distributions. Suppose a continuous lifetime T has survival function S(O), hazard function h(i),...
 3. Classifying Life Distributions. Suppose a continuous lifetime T has survival function S(O), hazard function h(i), cumulative hazard function (1), and mean residual life m(t). Consider the following properties that I might have: I. h(t) is nondecreasing for 120, called increasing failure rate (IFR). II. HIV/1 is nondefreasing for >0, called increasing failure rate on the average (IFRA). II. ml) Sm(0) for all / 20, called new better than used (NBU). IV. m(1) decreases in 1, called decreasing mean residual...
1. Suppose that the production function for lava lamps is given by Q = KL -ľ, where is the number of lamps produced pe...
 1. Suppose that the production function for lava lamps is given by Q = KL -ľ, where is the number of lamps produced per year, K is the machine-hours of capital, and L is the man-hours of labor. Suppose K = 600. a. Draw a graph of the production function over the range L = 0 to L = 500, putting L on the horizontal axis and on the vertical axis. Over what range of L does the production function...
NEED ANSWERS OF PART (f,g,h,j) Problem 2 [21 marks] Consider a firm that uses two inputs. The quantity used of input 1...
 NEED ANSWERS OF PART (f,g,h,j)
Problem 2 [21 marks] Consider a firm that uses two inputs. The quantity used of input 1 is denoted by x, and the quantity used of input 2 is denoted by x2. The firm produces and sells one good using the production function f(x1, x2)-4x053x25. The final good is sold at price P $10. The prices of inputs 1 and 2 are w$2 and w2 $3, respectively. The markets for the final good and both...
NEED ANSWERS OF PART (f,g,h,j)
Problem 2 [21 marks] Consider a firm that uses two inputs. The quantity used of input 1 is denoted by x, and the quantity used of input 2 is denoted by x2. The firm produces and sells one good using the production function f(x1, x2)-4x053x25. The final good is sold at price P $10. The prices of inputs 1 and 2 are w$2 and w2 $3, respectively. The markets for the final good and both...
1. Suppose that a single-price monopolist faces the demand function P 100 Q where I is...
 1. Suppose that a single-price monopolist faces the demand function P 100 Q where I is average weekly household income, and that the firm's marginal cost function is given by MC(Q) 2Q. The firm has no fixed costs. = (a) If the average weekly household income is $600, find the firm's marginal revenue function. (b) What is the firm's profit-maximizing quantity of output? At what price will the firm sell that output? What will the firm's marginal cost be? (c)...
pls solve parts g,h,i, j Suppose Country X's production function is given by F(K, A,N) =...
 pls solve parts g,h,i, j
Suppose Country X's production function is given by F(K, A,N) = 206,05(A, N,905 where K, is the capital and A, N, is the effective worker. The evolution of the capital stock is given by K +1 = 0.74K, +1 where the depreciation rate is 26%. Additionally, the saving rate is 36%, the population growth rate is 4% and the technological growth rate is 10% (a) Derive and show that in the Solow growth model, the...
pls solve parts g,h,i, j
Suppose Country X's production function is given by F(K, A,N) = 206,05(A, N,905 where K, is the capital and A, N, is the effective worker. The evolution of the capital stock is given by K +1 = 0.74K, +1 where the depreciation rate is 26%. Additionally, the saving rate is 36%, the population growth rate is 4% and the technological growth rate is 10% (a) Derive and show that in the Solow growth model, the...
NEED ALL ANSWERS PLEASE Problem 3 [24 marks] A competitive firm uses two inputs, capital (k) and labour (), to produce...
 NEED ALL ANSWERS PLEASE
Problem 3 [24 marks] A competitive firm uses two inputs, capital (k) and labour (), to produce one output, (y). The price of capital, W, is S1 per unit and the price of labor, wi, is SI per unit. The firm operates in competitive markets for outputs and inputs, so takes the prices as given. The production function is f(k,l) 3k025/025. The maximum amount of output produced for a givern amount of inputs is y(k, l)...
NEED ALL ANSWERS PLEASE
Problem 3 [24 marks] A competitive firm uses two inputs, capital (k) and labour (), to produce one output, (y). The price of capital, W, is S1 per unit and the price of labor, wi, is SI per unit. The firm operates in competitive markets for outputs and inputs, so takes the prices as given. The production function is f(k,l) 3k025/025. The maximum amount of output produced for a givern amount of inputs is y(k, l)...
1. [50 pts] Suppose we have the following production function generated from the use of only...
1. [50 pts] Suppose we have the following production function generated from the use of only one variable input, labour (L): ??? = 0.4? + 0.09?2 − 0.0035?3 Where TPP represents the total physical product and L is measured in 1000 hour increments (ie 1.5=1500 hours). The Marginal Physical Product curve is represented by: ??? = 0.4 + 0.18? − 0.0105?2 e) [5 pts] Using Excel, or some other spreadsheet program, graph the production function. On a separate graph, plot...
 Suppose life expectancy in years (L) is a function of two inputs, health expenditures (H) and nutrition expenditures (N) in hundreds of dollars per year. The production function is L-ch0.20 0.80 Beginning with a health input of $400 per year (H = 4) and a nutrition input of $400 per year (N = 4), show that the marginal product of health expenditures and the marginal product of nutrition expenditures are both decreasing. The change in the marginal product of health...
 Suppose life expectancy in years (L) is a function of two inputs, health expenditures (H) and nutrition expenditures (N) in hundreds of dollars per year. The production function is LE CH0.40 0.60 Beginning with c= 1, a health input of $300 per year (H = 3) and a nutrition input of $500 per year (N = 5), show that the marginal product of health expenditures and the marginal product of nutrition expenditures are both decreasing. Life expectancy (L) , The...
 Suppose we are graphing the health stock H as a function of
medical spending M; where the function H = H(M) is increasing at a
decreasing rate (H0 > 0 and H00 < 0): Researchers argue that
the rise of agricultural output increased the height and weight of
humans allowing them to better Öght o§ infectious diseases.
Graphically illustrate how improved technology in agriculture may
have altered the health production function if this theory is
correct.
Suppose we are graphing...
Suppose we are graphing the health stock H as a function of
medical spending M; where the function H = H(M) is increasing at a
decreasing rate (H0 > 0 and H00 < 0): Researchers argue that
the rise of agricultural output increased the height and weight of
humans allowing them to better Öght o§ infectious diseases.
Graphically illustrate how improved technology in agriculture may
have altered the health production function if this theory is
correct.
Suppose we are graphing...
 3. Classifying Life Distributions. Suppose a continuous lifetime T has survival function S(O), hazard function h(i), cumulative hazard function (1), and mean residual life m(t). Consider the following properties that I might have: I. h(t) is nondecreasing for 120, called increasing failure rate (IFR). II. HIV/1 is nondefreasing for >0, called increasing failure rate on the average (IFRA). II. ml) Sm(0) for all / 20, called new better than used (NBU). IV. m(1) decreases in 1, called decreasing mean residual...
 1. Suppose that the production function for lava lamps is given by Q = KL -ľ, where is the number of lamps produced per year, K is the machine-hours of capital, and L is the man-hours of labor. Suppose K = 600. a. Draw a graph of the production function over the range L = 0 to L = 500, putting L on the horizontal axis and on the vertical axis. Over what range of L does the production function...
 NEED ANSWERS OF PART (f,g,h,j)
Problem 2 [21 marks] Consider a firm that uses two inputs. The quantity used of input 1 is denoted by x, and the quantity used of input 2 is denoted by x2. The firm produces and sells one good using the production function f(x1, x2)-4x053x25. The final good is sold at price P $10. The prices of inputs 1 and 2 are w$2 and w2 $3, respectively. The markets for the final good and both...
NEED ANSWERS OF PART (f,g,h,j)
Problem 2 [21 marks] Consider a firm that uses two inputs. The quantity used of input 1 is denoted by x, and the quantity used of input 2 is denoted by x2. The firm produces and sells one good using the production function f(x1, x2)-4x053x25. The final good is sold at price P $10. The prices of inputs 1 and 2 are w$2 and w2 $3, respectively. The markets for the final good and both...
 1. Suppose that a single-price monopolist faces the demand function P 100 Q where I is average weekly household income, and that the firm's marginal cost function is given by MC(Q) 2Q. The firm has no fixed costs. = (a) If the average weekly household income is $600, find the firm's marginal revenue function. (b) What is the firm's profit-maximizing quantity of output? At what price will the firm sell that output? What will the firm's marginal cost be? (c)...
 pls solve parts g,h,i, j
Suppose Country X's production function is given by F(K, A,N) = 206,05(A, N,905 where K, is the capital and A, N, is the effective worker. The evolution of the capital stock is given by K +1 = 0.74K, +1 where the depreciation rate is 26%. Additionally, the saving rate is 36%, the population growth rate is 4% and the technological growth rate is 10% (a) Derive and show that in the Solow growth model, the...
pls solve parts g,h,i, j
Suppose Country X's production function is given by F(K, A,N) = 206,05(A, N,905 where K, is the capital and A, N, is the effective worker. The evolution of the capital stock is given by K +1 = 0.74K, +1 where the depreciation rate is 26%. Additionally, the saving rate is 36%, the population growth rate is 4% and the technological growth rate is 10% (a) Derive and show that in the Solow growth model, the...
 NEED ALL ANSWERS PLEASE
Problem 3 [24 marks] A competitive firm uses two inputs, capital (k) and labour (), to produce one output, (y). The price of capital, W, is S1 per unit and the price of labor, wi, is SI per unit. The firm operates in competitive markets for outputs and inputs, so takes the prices as given. The production function is f(k,l) 3k025/025. The maximum amount of output produced for a givern amount of inputs is y(k, l)...
NEED ALL ANSWERS PLEASE
Problem 3 [24 marks] A competitive firm uses two inputs, capital (k) and labour (), to produce one output, (y). The price of capital, W, is S1 per unit and the price of labor, wi, is SI per unit. The firm operates in competitive markets for outputs and inputs, so takes the prices as given. The production function is f(k,l) 3k025/025. The maximum amount of output produced for a givern amount of inputs is y(k, l)...
Most questions answered within 3 hours.
-
A 747 has a cruising speed of 235 m/s at a height of 10,700
meters. The...
asked 6 minutes ago -
Part 3: Arrows
Write a python program that prompts the user for a number of
columns,...
asked 14 minutes ago -
Need help answering these questions!!
1. What economic concept do you find most interesting in
Macroeconomics?...
asked 18 minutes ago -
1. Nimbus, Inc. produces and sells brooms. This table shows the
relationship between the number of...
asked 21 minutes ago -
A gas occupies 200. mL in a piston. If the pressure of the
piston were decreased...
asked 38 minutes ago -
A fossil is found to have a 14C level of 71.0% compared to
living organisms. How...
asked 42 minutes ago -
Many communist or socialist countries have a department that
addresses public health as well as the...
asked 44 minutes ago -
the following questions are either true or false answers
1. The Central Limit Theorem allows one...
asked 44 minutes ago -
The patient recovery time from a particular surgical procedure
is normally distributed with a mean of...
asked 50 minutes ago -
Human relations refer to the way a company arranges people,
jobs, and communications so that work...
asked 1 hour ago -
Python Program: Design the logic for and implement a program
that merges the two files into...
asked 1 hour ago -
The specific radiocarbon activity of a sample of wood is 6.25
gms dpm/gm of carbon. The...
asked 1 hour ago