Determine the equation of the regression line for the following data, and compute the residuals. x...
Determine the equation of the regression line for the following data, and compute the residuals.
| x | 16 | 7 | 19 | 13 | 4 |
| y | 47 | 36 | 53 | 45 | 18 |
Do not round the intermediate values. (Round your
answers to 3 decimal places.)
y^=(______)+(________)x
Do not round the intermediate values. (Round your
answers to 3 decimal places.)
Find below's Residuals
| x | y | Residuals |
| 16 | 47 |
|
| 7 | 36 |
? |
| 19 | 53 |
|
| 13 | 45 |
|
| 4 | 18 |
|
 ?
?Homework Answers
The statistic software output for this problem is:
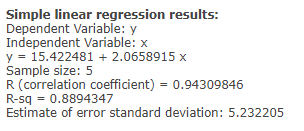
y hat = 15.422 + 2.066 x
x y Residuals
16 47 -1.477
7 36 6.116
19 53 -1.674
13 45 2.721
4 18 -5.686
Add Answer to:
Determine the equation of the regression line for the following
data, and compute the residuals.
x...
Consider the following sample data: x 32 23 18 36 13 40 35 24 y 31...
Consider the following sample data: x 32 23 18 36 13 40 35 24 y 31 37 34 60 25 45 43 38 Click here for the Excel Data File b. Calculate b1 and b0. What is the sample regression equation? (Round intermediate calculations to at least 4 decimal places and final answers to 2 decimal places.) yˆy^ + x c. Find the predicted value for y if x equals 11, 16, and 21. (Round intermediate coefficient values and final answers to...
6) Compute the least-squares regression line for predicting y from x given the following summary statistics....
6) Compute the least-squares regression line for predicting y from x given the following summary statistics. Round the slope and y -intercept to at least four decimal places. = x 8.8 = s x 1.2 = y 30.4 = s y 16 = r 0.60 Send data to Excel Regression line equation: = y 7)Compute the least-squares regression equation for the given data set. Use a TI- 84 calculator. Round the slope and y -intercept to at least four decimal...
Find the equation of the regression line for the given data. Then construct a scatter plot...
 Find the equation of the regression line for the given data. Then construct a scatter plot of the given x-values, if meaningful. The table below shows the heights (in feet) and the number of stories of Height, Stories, y data and draw the regression line. (The pair of variables have a signiicant correlation.) Then use the regression equation to predict the value of y for each of the sb. notable buildings in a city 775 53 619 47 519 46...
Find the equation of the regression line for the given data. Then construct a scatter plot...
Find the equation of the regression line for the given data. Then construct a scatter plot of the data and draw the regression line. (The pair of variables have a significant correlation.) Then use the regression equation to predict the value of y for each of the given x-values, if meaningful. The table below shows the heights (in feet) and the number of stories of six notable buildings in a city. Height comma xHeight, x 764 625 520 510 492...
Find the equation of the regression line for the given data. Then construct a scater plot...
 Find the equation of the regression line for the given data. Then construct a scater plot of the data and draw the regression line (The pair of variubles have a significant comelation) Then use the regression equation to predict the vakue of y for each of the given x-values, if meaningul The table below shows the heights (in feet) and the number of shories of six notable buildings in a city 758 Height, K Stories, y 621 47 (a)490 feet...
Consider the following data for a dependent variable y and two independent variables, x1 and x2...
 Consider the following data for a dependent variable y and two independent variables, x1 and x2 30 12. 95 47 10 108 24 18 113 51 16 178 41 6 95 51 20 175 75 7 170 36 12 118 142 59 13 77 17 212 Round your all answers to two decimal places. Enter negative values as negative numbers, if necessary. a. Develop an estimated regression equation relating y to ai 1 Predict y if 1 = 45 b....
For the data set below (a) Determine the least-squares regression line. (b) Compute the sum of...
 For the data set below (a) Determine the least-squares regression line. (b) Compute the sum of the squared residuals for the least-squares regression line. x 30 40 50 60 70 y 80 73 64 48 43 (a) Determine the least-squares regression line. ỳ-Ux + ] (Round to four decimal places as needed.) (b) The sum of the squared residuals is (Round to two decimal places as needed.)
Determine the value of the coefficient of correlation, r, for the following data. X 4 6...
Determine the value of the coefficient of correlation, r, for the following data. X 4 6 7 11 16 17 21 Y 18 13 13 8 7 7 5 (Round the intermediate values to 3 decimal places. Round your answer to 3 decimal places.) r= ?
0 Find the equation of the regression line for the given data. The construct a scatter...
 0 Find the equation of the regression line for the given data. The construct a scatter plot of the date and draw the regression in (The pair of we have a significant corelation) Then use the regression equation to predict the value ofy for each of the given x-vous meaningful. The table below shows the heights on tool and the number of stories of si notable buildings in a city Helght, 775 510 500 (0) 500 fot b)x500 Stories 37...
Find the equation of the regression line for the given data Then construct a cate plot...
 Find the equation of the regression line for the given data Then construct a cate plot of the data and draw the regressionline(The pair of variables have a significant correlation) Then use the regression equation to pred the value of y for each of the given x-values, if meaningful The table below shows the heights in feet) and the number of stories of she notable buildings in a city Height, 766 620 508 (a)x562 fost (h) x646 feet Stories, y...
 Find the equation of the regression line for the given data. Then construct a scatter plot of the given x-values, if meaningful. The table below shows the heights (in feet) and the number of stories of Height, Stories, y data and draw the regression line. (The pair of variables have a signiicant correlation.) Then use the regression equation to predict the value of y for each of the sb. notable buildings in a city 775 53 619 47 519 46...
 Find the equation of the regression line for the given data. Then construct a scater plot of the data and draw the regression line (The pair of variubles have a significant comelation) Then use the regression equation to predict the vakue of y for each of the given x-values, if meaningul The table below shows the heights (in feet) and the number of shories of six notable buildings in a city 758 Height, K Stories, y 621 47 (a)490 feet...
 Consider the following data for a dependent variable y and two independent variables, x1 and x2 30 12. 95 47 10 108 24 18 113 51 16 178 41 6 95 51 20 175 75 7 170 36 12 118 142 59 13 77 17 212 Round your all answers to two decimal places. Enter negative values as negative numbers, if necessary. a. Develop an estimated regression equation relating y to ai 1 Predict y if 1 = 45 b....
 For the data set below (a) Determine the least-squares regression line. (b) Compute the sum of the squared residuals for the least-squares regression line. x 30 40 50 60 70 y 80 73 64 48 43 (a) Determine the least-squares regression line. ỳ-Ux + ] (Round to four decimal places as needed.) (b) The sum of the squared residuals is (Round to two decimal places as needed.)
 0 Find the equation of the regression line for the given data. The construct a scatter plot of the date and draw the regression in (The pair of we have a significant corelation) Then use the regression equation to predict the value ofy for each of the given x-vous meaningful. The table below shows the heights on tool and the number of stories of si notable buildings in a city Helght, 775 510 500 (0) 500 fot b)x500 Stories 37...
 Find the equation of the regression line for the given data Then construct a cate plot of the data and draw the regressionline(The pair of variables have a significant correlation) Then use the regression equation to pred the value of y for each of the given x-values, if meaningful The table below shows the heights in feet) and the number of stories of she notable buildings in a city Height, 766 620 508 (a)x562 fost (h) x646 feet Stories, y...
Most questions answered within 3 hours.
-
When a solid dissolves in water, heat may be evolved or
absorbed. The heat of dissolution...
asked 1 minute ago -
Leechtown Co. has 4.3 percent coupon bonds on the market with 18
years left to maturity....
asked 3 minutes ago -
Comment on how the conference could have been improved What
additional elements would you consider adding...
asked 12 minutes ago -
Sandra Clothing Company has invested $51,000,000 in its
business. The target rate of return for the...
asked 13 minutes ago -
"Discover the privacy concerns when applying Artificial
Intelligence into Big Data"
asked 13 minutes ago -
Explain why organisms that can survive and/or grow under aerobic
conditions need the enzymes catalase and...
asked 19 minutes ago -
Moonwalker Corporation issued 2,000 shares of its $10 par value
common stock for $60,000. Moonwalker also...
asked 18 minutes ago -
A microphone connected to an amplifier takes a 10 dB voice and
turns it into a...
asked 23 minutes ago -
Suppose the mean time spent by all Harper College students
preparing for final exams is believed...
asked 38 minutes ago -
Imagine you are examining the effects of smoking in
heart-disease death rates. You collect an SRS...
asked 40 minutes ago -
Use the price-demand equation to find E(p), the elasticity of
demand.
x=f(p)=150 - 55 ln(p)
E(p)...
asked 35 minutes ago -
Suppose you deposit $1000 today in an account, expecting at some
point to receive $2000. This...
asked 38 minutes ago