The following table Year A Returns B Returns 2005 -4.7% 17.7% 2006 1.4% -8.1% 2007 -31.4% ...
The following table
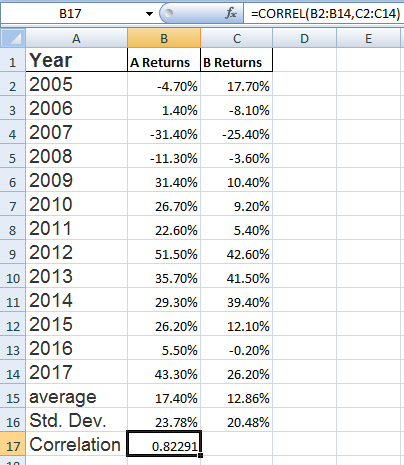
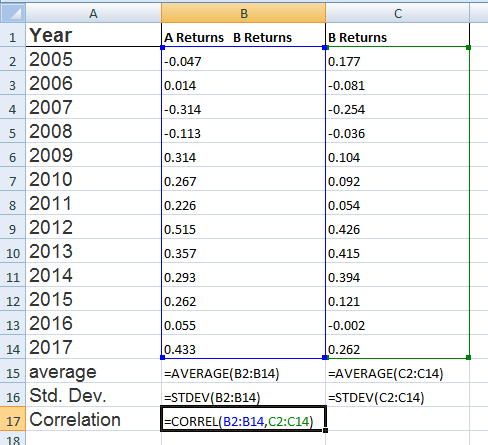
Year A Returns B Returns
2005 -4.7% 17.7%
2006 1.4% -8.1%
2007 -31.4% -25.4%
2008 -11.3% -3.6%
2009 31.4% 10.4%
2010 26.7% 9.2%
2011 22.6% 5.4%
2012 51.5% 42.6%
2013 35.7% 41.5%
2014 29.3% 39.4%
2015 26.2% 12.1%
2016 5.5% -0.2%
2017 43.3% 26.2%
contains annual returns for the stocks of Company Upper A (Upper A) and Company Upper B (Upper B).
The returns are calculated using end-of-year prices (adjusted for dividends and stock splits). Use the information for Company Upper A (Upper A) and Company Upper B (Upper B) to create an Excel spreadsheet that calculates the average returns over the 10-year period for portfolios comprised of Upper A and Upper B
using the following, respective, weightings: (1.0, 0.0), (0.9, 0.1), (0.8, 0.2), (0.7, 0.3), (0.6, 0.4), (0.5, 0.5), (0.4, 0.6), (0.3, 0.7), (0.2, 0.8), (0.1, 0.9), and (0.0, 1.0). The average annual returns over the 10-year period for Upper A and Upper B are 17.40% and 12.86% respectively. Also, calculate the portfolio standard deviation over the 10-year period associated with each portfolio composition. The standard deviation over the 10-year period for Company Upper A and Company Upper B and their correlation coefficient are 23.78%, 20.47%, and 0.82148 respectively. (Hint: Review Table)
Enter the average return and standard deviation for a portfolio with 100% Company Upper A and 0% Company Upper B in the table below. (round to 2 decimal places)
Portfolio Average return_______% Portfolio Standard Deviation_________%
Enter the average return and standard deviation for a portfolio with 90% Company Upper A and 10% Company Upper B in the table below. (Round to two decimal places)
Portfolio Average return________% Portfolio Standard Deviation_________%
Enter the average return and standard deviation for a portfolio with 80% Company Upper A and 20% Company Upper B in the table below. (Round to two decimal places.)
Portfolio Average return________% Portfolio Standard Deviation_________%
Enter the average return and standard deviation for a portfolio with 70% Company Upper A and 30% Company Upper B in the table below. (Round to two decimal places.)
Portfolio Average return________% Portfolio Standard Deviation_________%
Enter the average return and standard deviation for a portfolio with 60% Company Upper A and 40% Company Upper B in the table below. (Round to two decimal places.)
Portfolio Average return________% Portfolio Standard Deviation_________%
Enter the average return and standard deviation for a portfolio with 50% Company Upper A and 50% Company Upper B in the table below. (Round to two decimal places.)
Portfolio Average return________% Portfolio Standard Deviation_________%
Enter the average return and standard deviation for a portfolio with 60% Company Upper A and 50% Company Upper B in the table below. (Round to two decimal places.)
Portfolio Average return________% Portfolio Standard Deviation_________%
Enter the average return and standard deviation for a portfolio with 70% Company Upper A and 50% Company Upper B in the table below. (Round to two decimal places.)
Portfolio Average return________% Portfolio Standard Deviation_________%
Enter the average return and standard deviation for a portfolio with 80% Company Upper A and 50% Company Upper B in the table below. (Round to two decimal places.)
Portfolio Average return________% Portfolio Standard Deviation_________%
Enter the average return and standard deviation for a portfolio with 90% Company Upper A and 50% Company Upper B in the table below. (Round to two decimal places.)
Portfolio Average return________% Portfolio Standard Deviation_________%
Enter the average return and standard deviation for a portfolio with 100% Company Upper A and 50% Company Upper B in the table below. (Round to two decimal places.)
Portfolio Average return________% Portfolio Standard Deviation_________%
Homework Answers
Expected return of two-asset portfolio Rp = w1R1 + w2R2,
where Rp = expected return
w1 = weight of Asset 1
R1 = expected return of Asset 1
w2 = weight of Asset 2
R2 = expected return of Asset 2
Standard deviation for a two-asset portfolio σp = (w12σ12 + w22σ22 + 2w1w2Cov1,2)0.5
where σp = standard deviation of the portfolio
w1 = weight of Asset 1
w2 = weight of Asset 2
σ12 = variance of Asset 1
σ22 = variance of Asset 2
Cov1,2 = covariance of returns between Asset 1 and Asset 2
Cov1,2 = ρ1,2 * σ1 * σ2, where ρ1,2 = correlation of returns between Asset 1 and Asset 2


Add Answer to:
The following table
Year A Returns B Returns
2005 -4.7% 17.7%
2006 1.4% -8.1%
2007 -31.4% ...
The following table, contains annual returns for the stocks of ABC Corp. (ABC) and Company B...
 The following table, contains annual returns for the stocks of ABC Corp. (ABC) and Company B (B). The returns are calculated using end-of-year prices (adjusted for dividends and stock splits) retrieved from http://www.finance.yahoo.com/. Use the information to create an Excel spreadsheet that calculates the standard deviation of annual returns over the 10-year period for ABC, B, and of the equally-weighted portfolio of ABC and B over the 10-year period. (Hint: Review the Excel screenshot on page 173.) The average annual...
Stocks A and B have the following historical returns: Year Stock A's Returns, A Stock B's...
 Stocks A and B have the following historical returns: Year Stock A's Returns, A Stock B's Returns, re 2011 - 23.40% 15.7094 2012 31.50 29.30 2013 17.75 28.40 2014 - 1.50 - 12.80 2015 29.00 24.15 .. Calculate the average rate of return for stock A during the period 2011 through 2015. Round your answer to two decimal places. Calculate the average rate of return for stock B during the period 2011 through 2015. Round your answer to two decimal...
REALIZED RATES OF RETURN NEED TO BE DONE USING EXCEL!!!! Stocks A and B have the following historical returns: Year S...
REALIZED RATES OF RETURN NEED TO BE DONE USING EXCEL!!!! Stocks A and B have the following historical returns: Year Stock A's Returns, rA Stock B's Returns, rB 2011 - 24.00% - 12.10% 2012 20.50 23.70 2013 17.75 31.90 2014 - 5.25 - 11.70 2015 25.75 2.95 Calculate the average rate of return for stock A during the period 2011 through 2015. Round your answer to two decimal places. % Calculate the average rate of return for stock B during...
REALIZED RATES OF RETURN Stocks A and B have the following historical returns: Stock B's Returns,...
 REALIZED RATES OF RETURN Stocks A and B have the following historical returns: Stock B's Returns, rs Stock A's Returns, rA Year - 13.50 % -15.00% 2011 19.60 31.75 2012 32.10 12.00 2013 -10.80 -4.00 2014 24.85 27.50 2015 a. Calculate the average rate of return for stock A during the period 2011 through 2015. Round your answer to two decimal places. % Calculate the average rate of return for stock B during the period 2011 through 2015. Round your...
Stocks A and B have the following historical returns: Year 2012 -20.10% -12.60% 2013 20.50 24.30...
Stocks A and B have the following historical returns: Year 2012 -20.10% -12.60% 2013 20.50 24.30 2014 17.25 30.90 2015 -3.25 -10.10 2016 29.50 11.40 Calculate the average rate of return for each stock during the 5-year period. Round your answers to two decimal places. Stock A % Stock B % Assume that someone held a portfolio consisting of 50% of Stock A and 50% of Stock B. What would have been the realized rate of return on the portfolio...
Stocks A and B have the following historical returns Year Stock A'sReturns, A Stock B's Returns,...
 Stocks A and B have the following historical returns Year Stock A'sReturns, A Stock B's Returns, rB 2011 2012 2013 2014 2015 23.00%, 26.75 15.75 3.50 29.50 1 7.50% 16,80 26.40 10.40 30.20 a. Calculate the average rate of retum for stock A during the period 2011 through 2015. Round your answer to two decimal places. Calculate the average rate of retum for stock 8 during the period 2011 through 2015. Round your answer to two decimal places, b Assume...
20. Problem 8.20 (Realized Rates of Return) eBook Stocks A and B have the following historical returns: Year Stock A's...
 20. Problem 8.20 (Realized Rates of Return) eBook Stocks A and B have the following historical returns: Year Stock A's Returns, A Stock B's Returns, rB 2013 - 23.30% - 15.50% 2014 20.10 20.00 10.00 2015 31.60 - 12.80 2016 - 2.50 2017 27.25 8.05 a. Calculate the average rate of return for stock A during the period 2013 through 2017. Round your answer to two decimal places. Calculate the average rate of return for stock B during the period...
Consider the following table for a period of six years: Year Returns Large- U.S. Company Stocks...
 Consider the following table for a period of six years: Year Returns Large- U.S. Company Stocks Treasury Bills - 16.39% 7.63% -26.98 8.16 37.57 6.21 24.27 6.77 - 7.84 5.62 6.91 8.15 Un a-1. Calculate the arithmetic average returns for large-company stocks and T-bills over this time period. (Do not round intermediate calculations and enter your answers as a percent rounded to 2 decimal places, e.g., 32.16.) a-2. Calculate the standard deviation of the returns for large-company stocks and T-bills...
Consider the following table for a period of six years: Year Returns Large- U.S. Company Treasury...
 Consider the following table for a period of six years: Year Returns Large- U.S. Company Treasury Bills Stocks - 15.59% 7.47% -26.74 8.08 37.41 6.05 24.11 5.97 - 7.52 5.54 6.75 7.91 ou WN- a-1. Calculate the arithmetic average returns for large-company stocks and T-bills over this time period. (Do not round intermediate calculations and enter your answers as a percent rounded to 2 decimal places, e.g., 32.16.) a-2. Calculate the standard deviation of the returns for large-company stocks and...
Historical Realized Rates of Return Stocks A and B have the following historical returns: Year 2012...
Historical Realized Rates of Return Stocks A and B have the following historical returns: Year 2012 -23.00% -17.10% 2013 26.00 27.00 2014 10.75 20.80 2015 -2.25 -13.60 2016 31.50 25.90 Calculate the average rate of return for each stock during the 5-year period. Round your answers to two decimal places. Stock A % Stock B % Assume that someone held a portfolio consisting of 50% of Stock A and 50% of Stock B. What would have been the realized rate...
 The following table, contains annual returns for the stocks of ABC Corp. (ABC) and Company B (B). The returns are calculated using end-of-year prices (adjusted for dividends and stock splits) retrieved from http://www.finance.yahoo.com/. Use the information to create an Excel spreadsheet that calculates the standard deviation of annual returns over the 10-year period for ABC, B, and of the equally-weighted portfolio of ABC and B over the 10-year period. (Hint: Review the Excel screenshot on page 173.) The average annual...
 Stocks A and B have the following historical returns: Year Stock A's Returns, A Stock B's Returns, re 2011 - 23.40% 15.7094 2012 31.50 29.30 2013 17.75 28.40 2014 - 1.50 - 12.80 2015 29.00 24.15 .. Calculate the average rate of return for stock A during the period 2011 through 2015. Round your answer to two decimal places. Calculate the average rate of return for stock B during the period 2011 through 2015. Round your answer to two decimal...
 REALIZED RATES OF RETURN Stocks A and B have the following historical returns: Stock B's Returns, rs Stock A's Returns, rA Year - 13.50 % -15.00% 2011 19.60 31.75 2012 32.10 12.00 2013 -10.80 -4.00 2014 24.85 27.50 2015 a. Calculate the average rate of return for stock A during the period 2011 through 2015. Round your answer to two decimal places. % Calculate the average rate of return for stock B during the period 2011 through 2015. Round your...
 Stocks A and B have the following historical returns Year Stock A'sReturns, A Stock B's Returns, rB 2011 2012 2013 2014 2015 23.00%, 26.75 15.75 3.50 29.50 1 7.50% 16,80 26.40 10.40 30.20 a. Calculate the average rate of retum for stock A during the period 2011 through 2015. Round your answer to two decimal places. Calculate the average rate of retum for stock 8 during the period 2011 through 2015. Round your answer to two decimal places, b Assume...
 20. Problem 8.20 (Realized Rates of Return) eBook Stocks A and B have the following historical returns: Year Stock A's Returns, A Stock B's Returns, rB 2013 - 23.30% - 15.50% 2014 20.10 20.00 10.00 2015 31.60 - 12.80 2016 - 2.50 2017 27.25 8.05 a. Calculate the average rate of return for stock A during the period 2013 through 2017. Round your answer to two decimal places. Calculate the average rate of return for stock B during the period...
 Consider the following table for a period of six years: Year Returns Large- U.S. Company Stocks Treasury Bills - 16.39% 7.63% -26.98 8.16 37.57 6.21 24.27 6.77 - 7.84 5.62 6.91 8.15 Un a-1. Calculate the arithmetic average returns for large-company stocks and T-bills over this time period. (Do not round intermediate calculations and enter your answers as a percent rounded to 2 decimal places, e.g., 32.16.) a-2. Calculate the standard deviation of the returns for large-company stocks and T-bills...
 Consider the following table for a period of six years: Year Returns Large- U.S. Company Treasury Bills Stocks - 15.59% 7.47% -26.74 8.08 37.41 6.05 24.11 5.97 - 7.52 5.54 6.75 7.91 ou WN- a-1. Calculate the arithmetic average returns for large-company stocks and T-bills over this time period. (Do not round intermediate calculations and enter your answers as a percent rounded to 2 decimal places, e.g., 32.16.) a-2. Calculate the standard deviation of the returns for large-company stocks and...
Most questions answered within 3 hours.
-
for python-3
I want to prompt the user to enter their first name and then
Call...
asked 13 seconds from now -
Q3 If the formation of a hairpin loop requires a minimum
stem
length of 6 contiguous...
asked 6 minutes ago -
Enzymes work by lowering the _____ of a reaction.
Select one:
a. activation energy
b. entropy...
asked 52 minutes ago -
Assume three digits are used to represent positive integers and
also assume the following operations are...
asked 1 hour ago -
How many stairs can a 63-kg person climb up with the energy
contained in a candy...
asked 1 hour ago -
Problem 1
A 0.150 kg baseball pitched at 40.0 m/s is hit on a horizontal
line...
asked 1 hour ago -
Variance in reproductive success. The variance among male
reproductive success is 2 and the variance among...
asked 3 hours ago -
To decide your fate, you will play a board game on a simple
board: a linear...
asked 5 hours ago -
1. What are specialty engines? ( )
a. Logical Processors that perform specialized functions
b. An...
asked 6 hours ago -
a. What double precision floating point
number is represented by the following 64-bit binary? Show your...
asked 7 hours ago -
Indicate whether the statement is true or false
(1-20).
1)A good time management plan will eliminate...
asked 8 hours ago -
Which one of the following will occur when the internal rate of
return equals the required...
asked 8 hours ago