As consultants in advisory services at an accounting firm, we are hired by management of Gadberry to advise on cash flow reporting. Management is concerned about the relatively small net increase in cash, and how the company is doing compared to competitors Nessly and Tootsey. The following Tableau Dashboard will assist in our analysis.


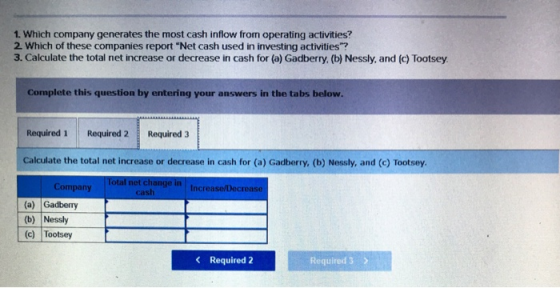
1. Which company generates the most cash inflow from operating activities? 2. Which of these companies report "Net cash used in investing activities? 3. Calculate the total net increase or decrease in cash for (a) Gadberry. (b) Nessly, and (c) Tootsey.
Homework Answers
Part 1
|
Which company generates the most cash inflow from operating activities? |
Gadberry |
Gadberry = $40000
Nessly = $(30000)
Tootsey = $10000
Part 2
|
Which of these companies report "Net cash used in investing activities"? |
Gadberry Tootsey |
Net cash used in investing activities refers to cash outflow from operating activities
Part 3
|
Company |
Total net change in cash |
Increase/decrease |
|
|
(a) |
Gadberry |
$2000 |
Increase |
|
(b) |
Nessly |
$10000 |
Increase |
|
(c) |
Tootsey |
$47000 |
Increase |
Total net change in cash = cash flow from operating activities + cash flow from investing activities and cash flow from financing activities
Gadberry = 40000-4000-34000 = $2000
Nessly = -30000+15000+25000 = $10000
Tootsey = 10000-9000+46000 = $47000
As all numbers are positive it indicates there is increase in cash balance
Add Answer to:
As consultants in advisory services at an accounting firm, we are hired by management of Gadberry...
As consultants in advisory services at an accounting firm, weare hired by management of Gadberry...
 As consultants in advisory services at an accounting firm, we
are hired by management of Gadberry to advise on cash flow
reporting. Management is concerned about the relatively small net
increase in cash, and how the company is doing compared to
competitors Nessly and Tootsey. The following Tableau Dashboard
will assist in our analysis.Gadberry (green) Operating Activities:
$40,000Nessly (Red) Investing Activites: $15,000Nessly (Orange) Financing: $25,000Tootsey (Green) Operating Activities:
$10,000Gadberry (Red) Investing Activities:
$(4,000)Gadberry (Orange) Financing Activities:
$(34,000)Nessly (Green) Operating Activites:...
As consultants in advisory services at an accounting firm, we
are hired by management of Gadberry to advise on cash flow
reporting. Management is concerned about the relatively small net
increase in cash, and how the company is doing compared to
competitors Nessly and Tootsey. The following Tableau Dashboard
will assist in our analysis.Gadberry (green) Operating Activities:
$40,000Nessly (Red) Investing Activites: $15,000Nessly (Orange) Financing: $25,000Tootsey (Green) Operating Activities:
$10,000Gadberry (Red) Investing Activities:
$(4,000)Gadberry (Orange) Financing Activities:
$(34,000)Nessly (Green) Operating Activites:...
We were unable to transcribe this image$(10,000) $(20,000) Cash Outflows $(30,000) $(40,000) Operating Activities Investing Activities...
 We were unable to transcribe this image$(10,000) $(20,000) Cash Outflows $(30,000) $(40,000) Operating Activities Investing Activities Financing Activities $(50,000) Net Income (Loss) for Competing Companies Gadberry Nessly Tootsey $(40,000) $(30,000) $(20,000) $(10,000) $0 $10,000 $20,000 $30,000 $40,000 Net Loss Net Income tableau < » K og Po 1. Which company generates the most cash inflow from operating activities? 2. Which of these companies report “Net cash used in investing activities”? 3. Calculate the total net increase or decrease in cash...
1. Which company generates the most cash inflow from operating activities?
 1. Which company generates the most cash inflow from operating activities? 2. Which of these companies report "Net cash used in investing activities"? 3. Calculate the total net increase or decrease in cash for (a) Gadberry, (b) Nessly, and (c) Tootsey.
REQ 1 and 2 are decreased/increase. As consultants, we are hired to help the company track...
 REQ 1 and 2 are
decreased/increase.
As consultants, we are hired to help the company track and report costs. The following Tableau Dashboard is provided to assist us in our analysis. Inventories Work in Process Raw Materials Finished Goods S21.000 S18,000 $15.000 $12.000 $9,000 56,000 $3,000 $0 November 30 December 31 November 30 December 31 November 30 December 31 Factory Overhead for December Sales, Materials, and Payroll for December Indirect materials Indirect labor Factory payroll Raw materials purchases Total Overhead...
REQ 1 and 2 are
decreased/increase.
As consultants, we are hired to help the company track and report costs. The following Tableau Dashboard is provided to assist us in our analysis. Inventories Work in Process Raw Materials Finished Goods S21.000 S18,000 $15.000 $12.000 $9,000 56,000 $3,000 $0 November 30 December 31 November 30 December 31 November 30 December 31 Factory Overhead for December Sales, Materials, and Payroll for December Indirect materials Indirect labor Factory payroll Raw materials purchases Total Overhead...
2. Asset management ratios Asset management ratios are used to measure how effectively a firm manages...
 2. Asset management ratios Asset management ratios are used to measure how effectively a firm manages its assets, by relating the amount a firm has invested in a particular type of asset (or group of assets) to the amount of revenues the asset is generating. Examples of asset management ratios include the average collection pericod (also called the days sales outstanding ratio), the inventory turnover ratio, the fixed asset turnover ratio, and the total asset turnover ratio. Consider the following...
3. Asset management ratios Asset management ratios are used to measure how effectively a firm manages...
3. Asset management ratios Asset management ratios are used to measure how effectively a firm manages its assets, by relating the amount a firm has invested in a particular type of asset (or group of assets) to the amount of revenues the asset is generating. Examples of asset management ratios include the average collection period (also called the days sales outstanding ratio), the inventory turnover ratio, the fixed asset turnover ratio, and the total asset turnover ratio. Consider the following...
3. Asset management ratios Asset management ratios are used to measure how effectively a firm manages...
 3. Asset management ratios Asset management ratios are used to measure how effectively a firm manages its assets, by relating the amount a firm has invested in a particular type of asset (or group of assets) to the amount of revenues the asset is generating. Examples of asset management ratios include the average collection period (also called the days sales outstanding ratio), the inventory turnover ratio, the fixed asset turnover ratio, and the total asset turnover ratio. Consider the following...
Asset management ratios are used to measure how effectively a firm manages its assets, by relating...
 Asset management ratios are used to measure how effectively a firm manages its assets, by relating the amount a firm has invested in a particular type of asset (or group of assets) to the amount of revenues the asset is generating. Examples of asset management ratios include the average collection period (also called the days sales outstanding ratio), the inventory turnover ratio, the fixed asset turnover ratio, and the total asset turnover ratio. Consider the following case: Polk Software Inc....
Correctly answer is part of question 3 Aa Aa 3. Asset management ratios Asset management ratios...
 Correctly answer is part of question 3
Aa Aa 3. Asset management ratios Asset management ratios are used to measure how effectively a firm manages its assets, by relating the amount a firm has invested in a particular type of asset (or group of assets) to the amount of revenues the asset is generating. Examples of asset management ratios include the average collection period (also called the days sales outstanding ratio), the inventory turnover ratio, the fixed asset turnover ratio,...
Correctly answer is part of question 3
Aa Aa 3. Asset management ratios Asset management ratios are used to measure how effectively a firm manages its assets, by relating the amount a firm has invested in a particular type of asset (or group of assets) to the amount of revenues the asset is generating. Examples of asset management ratios include the average collection period (also called the days sales outstanding ratio), the inventory turnover ratio, the fixed asset turnover ratio,...
Chapter 4 Assignment 2. Asset management ratios Asset management ratios are used to measure how effectively...
 Chapter 4 Assignment 2. Asset management ratios Asset management ratios are used to measure how effectively a firm manages its assets, by relating the amount a firm has invested in a particular type of asset (or group of assets) to the amount of revenues the asset is generating. Examples of asset management ratios include the average collection period (also called the days sales outstanding ratio), the inventory turnover ratio, the fixed asset turnover ratio, and the total asset turnover ratio....
 As consultants in advisory services at an accounting firm, we
are hired by management of Gadberry to advise on cash flow
reporting. Management is concerned about the relatively small net
increase in cash, and how the company is doing compared to
competitors Nessly and Tootsey. The following Tableau Dashboard
will assist in our analysis.Gadberry (green) Operating Activities:
$40,000Nessly (Red) Investing Activites: $15,000Nessly (Orange) Financing: $25,000Tootsey (Green) Operating Activities:
$10,000Gadberry (Red) Investing Activities:
$(4,000)Gadberry (Orange) Financing Activities:
$(34,000)Nessly (Green) Operating Activites:...
As consultants in advisory services at an accounting firm, we
are hired by management of Gadberry to advise on cash flow
reporting. Management is concerned about the relatively small net
increase in cash, and how the company is doing compared to
competitors Nessly and Tootsey. The following Tableau Dashboard
will assist in our analysis.Gadberry (green) Operating Activities:
$40,000Nessly (Red) Investing Activites: $15,000Nessly (Orange) Financing: $25,000Tootsey (Green) Operating Activities:
$10,000Gadberry (Red) Investing Activities:
$(4,000)Gadberry (Orange) Financing Activities:
$(34,000)Nessly (Green) Operating Activites:...
 We were unable to transcribe this image$(10,000) $(20,000) Cash Outflows $(30,000) $(40,000) Operating Activities Investing Activities Financing Activities $(50,000) Net Income (Loss) for Competing Companies Gadberry Nessly Tootsey $(40,000) $(30,000) $(20,000) $(10,000) $0 $10,000 $20,000 $30,000 $40,000 Net Loss Net Income tableau < » K og Po 1. Which company generates the most cash inflow from operating activities? 2. Which of these companies report “Net cash used in investing activities”? 3. Calculate the total net increase or decrease in cash...
 1. Which company generates the most cash inflow from operating activities? 2. Which of these companies report "Net cash used in investing activities"? 3. Calculate the total net increase or decrease in cash for (a) Gadberry, (b) Nessly, and (c) Tootsey.
 REQ 1 and 2 are
decreased/increase.
As consultants, we are hired to help the company track and report costs. The following Tableau Dashboard is provided to assist us in our analysis. Inventories Work in Process Raw Materials Finished Goods S21.000 S18,000 $15.000 $12.000 $9,000 56,000 $3,000 $0 November 30 December 31 November 30 December 31 November 30 December 31 Factory Overhead for December Sales, Materials, and Payroll for December Indirect materials Indirect labor Factory payroll Raw materials purchases Total Overhead...
REQ 1 and 2 are
decreased/increase.
As consultants, we are hired to help the company track and report costs. The following Tableau Dashboard is provided to assist us in our analysis. Inventories Work in Process Raw Materials Finished Goods S21.000 S18,000 $15.000 $12.000 $9,000 56,000 $3,000 $0 November 30 December 31 November 30 December 31 November 30 December 31 Factory Overhead for December Sales, Materials, and Payroll for December Indirect materials Indirect labor Factory payroll Raw materials purchases Total Overhead...
 2. Asset management ratios Asset management ratios are used to measure how effectively a firm manages its assets, by relating the amount a firm has invested in a particular type of asset (or group of assets) to the amount of revenues the asset is generating. Examples of asset management ratios include the average collection pericod (also called the days sales outstanding ratio), the inventory turnover ratio, the fixed asset turnover ratio, and the total asset turnover ratio. Consider the following...
 3. Asset management ratios Asset management ratios are used to measure how effectively a firm manages its assets, by relating the amount a firm has invested in a particular type of asset (or group of assets) to the amount of revenues the asset is generating. Examples of asset management ratios include the average collection period (also called the days sales outstanding ratio), the inventory turnover ratio, the fixed asset turnover ratio, and the total asset turnover ratio. Consider the following...
 Asset management ratios are used to measure how effectively a firm manages its assets, by relating the amount a firm has invested in a particular type of asset (or group of assets) to the amount of revenues the asset is generating. Examples of asset management ratios include the average collection period (also called the days sales outstanding ratio), the inventory turnover ratio, the fixed asset turnover ratio, and the total asset turnover ratio. Consider the following case: Polk Software Inc....
 Correctly answer is part of question 3
Aa Aa 3. Asset management ratios Asset management ratios are used to measure how effectively a firm manages its assets, by relating the amount a firm has invested in a particular type of asset (or group of assets) to the amount of revenues the asset is generating. Examples of asset management ratios include the average collection period (also called the days sales outstanding ratio), the inventory turnover ratio, the fixed asset turnover ratio,...
Correctly answer is part of question 3
Aa Aa 3. Asset management ratios Asset management ratios are used to measure how effectively a firm manages its assets, by relating the amount a firm has invested in a particular type of asset (or group of assets) to the amount of revenues the asset is generating. Examples of asset management ratios include the average collection period (also called the days sales outstanding ratio), the inventory turnover ratio, the fixed asset turnover ratio,...
 Chapter 4 Assignment 2. Asset management ratios Asset management ratios are used to measure how effectively a firm manages its assets, by relating the amount a firm has invested in a particular type of asset (or group of assets) to the amount of revenues the asset is generating. Examples of asset management ratios include the average collection period (also called the days sales outstanding ratio), the inventory turnover ratio, the fixed asset turnover ratio, and the total asset turnover ratio....
Most questions answered within 3 hours.
-
Please help me with FLOWCHART and UML diagram for class,
thank you!
#include <iostream>
#include <fstream>...
asked 4 minutes ago -
3. Describe the “logic circuit” of the Lac operon. Which
proteins are bound or not to...
asked 5 minutes ago -
Ayesha’s adjusted gross income is $60,000 in 2019. She donated a
piece of artwork with a...
asked 12 minutes ago -
For Dijkstra’s shortest path algorithm:
a. Give the Big-O time for Dijkstra’s shortest path algorithm
and...
asked 24 minutes ago -
Phosphorus violates the 'octet rule' in biological molecules,
forming more covalent bonds than expected based on...
asked 27 minutes ago -
A 1.3 eV electron has a 10-4 probability of tunneling
through a 2.4 eV potential barrier....
asked 45 minutes ago -
What is the one ingredient that is common to being successful
with all stakeholders?
profit
trust...
asked 44 minutes ago -
Write an assembly language 32 bit program that reads in lines of
text by a .txt...
asked 47 minutes ago -
what is the density ( in g/L) of hydrogen gas at 29 degrees C and a...
asked 55 minutes ago -
5-6. You are considering three investment alternatives for some
spare cash: Old Reliable Corporation stock (A1),...
asked 47 minutes ago -
Problem 16-02
Receivables Investment
Medwig Corporation has a DSO of 45 days. The company averages
$7,250...
asked 1 hour ago -
Mr. Brown hired Lowe's Maintenance Services Limited to repair
and paint the exterior wall of his...
asked 1 hour ago