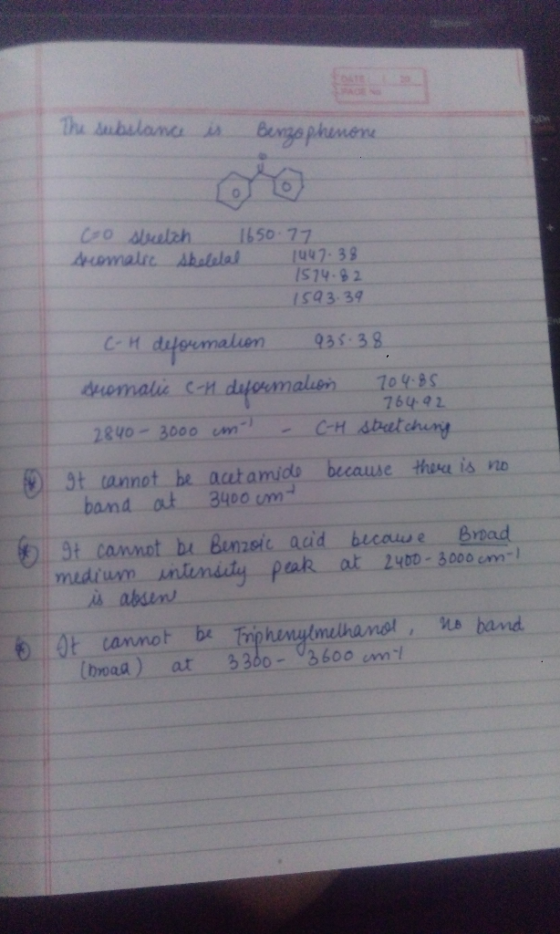
Interpret the IR spectra for an unknown solid substance. Label all major bond types, and identify the unknown substance.
The substance may be:
Acetamide
Benzoic Acid
Benzophenone
p-Aminobenzoic Acid
Triphenyl Methanol

Homework Answers
Add Answer to:
Interpret the IR spectra for an unknown solid substance.
Label all major bond types, and identify...
Interpret the IR spectra for an unknown liquid substance. Label all major bond types, and identify...
 Interpret the IR spectra for an unknown liquid substance.
Label all major bond types, and identify the
unknown substance.
The substance may be:
Acetone
Benzaldehyde
Diethyl Ether
Ethyl Acetate
Methanol
Methyl Benzoate
Toluene
1% "48000 3500 3000 2500 2000 1500 1000 600 cm-1
Interpret the IR spectra for an unknown liquid substance.
Label all major bond types, and identify the
unknown substance.
The substance may be:
Acetone
Benzaldehyde
Diethyl Ether
Ethyl Acetate
Methanol
Methyl Benzoate
Toluene
1% "48000 3500 3000 2500 2000 1500 1000 600 cm-1
What IR Spectra is this? The options are: Acetamide, Benzoic Acid, Benzophenone, p-Aminobenzoic Acid, and Triphenyl...
 What IR Spectra is this?
The options are: Acetamide, Benzoic Acid, Benzophenone,
p-Aminobenzoic Acid, and Triphenyl Methanol
1% 4000 3500 3000 2500 2000 1500 1000 650 cm-1
What IR Spectra is this?
The options are: Acetamide, Benzoic Acid, Benzophenone,
p-Aminobenzoic Acid, and Triphenyl Methanol
1% 4000 3500 3000 2500 2000 1500 1000 650 cm-1
Interpret the IR spectra for isoamyl acetate. Is the ester pure or crude? Label major bond...
 Interpret the IR spectra for isoamyl acetate. Is the ester pure
or crude? Label major bond types.
101, 100 %T 40+ 4000 3500 3000 2500 cm-1 2000 1500 1000 600
Interpret the IR spectra for isoamyl acetate. Is the ester pure
or crude? Label major bond types.
101, 100 %T 40+ 4000 3500 3000 2500 cm-1 2000 1500 1000 600
Identify this compound (label all major functional groups on IR spectra). SAMPLE 100- % TRANSMITTANCE 4000...
 Identify this compound (label all major
functional groups on IR spectra).
SAMPLE 100- % TRANSMITTANCE 4000 1000 3500 3000 2000 1500 2500 WAVENUMBERS 600.1
Identify this compound (label all major
functional groups on IR spectra).
SAMPLE 100- % TRANSMITTANCE 4000 1000 3500 3000 2000 1500 2500 WAVENUMBERS 600.1
Identify the peaks that identify the functional groups in the IR spectrum Unknown 4 C2H60 TRANSMITTANCE...
 Identify the peaks that identify the functional groups
in the IR spectrum
Unknown 4 C2H60 TRANSMITTANCE 1001- 0 900- 0 800- 0.700- 0.600- 0.500- 0.400- 0.300- 0200- 0.100- 0.000- 4000 IR Unknown 3500 3000 2500 2000 1000 1500 Load IR spectrum Load proton NMR Show structure Spectra are displayed using JSpecView Website maintained by Jennifer Muzyka Contact me at jennifer muzyka@centre edu. Unknown 5 C3H5NO TRANSMITTANCE 1.001 - 0.900- 0800- 0.700- 0.600- 0.500- 0.400- 0.300- 0 200- 0.100- 0 000...
Identify the peaks that identify the functional groups
in the IR spectrum
Unknown 4 C2H60 TRANSMITTANCE 1001- 0 900- 0 800- 0.700- 0.600- 0.500- 0.400- 0.300- 0200- 0.100- 0.000- 4000 IR Unknown 3500 3000 2500 2000 1000 1500 Load IR spectrum Load proton NMR Show structure Spectra are displayed using JSpecView Website maintained by Jennifer Muzyka Contact me at jennifer muzyka@centre edu. Unknown 5 C3H5NO TRANSMITTANCE 1.001 - 0.900- 0800- 0.700- 0.600- 0.500- 0.400- 0.300- 0 200- 0.100- 0 000...
Please label and interpret the following IR spectra of an unknown compound. Label each important absorption...
 Please label and interpret the following IR spectra of an
unknown compound. Label each important absorption on the spectrum
with a structural feature of your unknown and identify the unknown
compound.
Method Name Default_Method User chem Date/Time 02/28/2019 5.59:47 PM Range:4000-500 Apodization:Happ-Genzel Sample ID:solomon Sample Scans 3 Background Scans. 16 Resolution:4 System Status:Good File Location: C:lUsers Public Documents AgilentiMicrolablResultsilsolomon_2019-02-28T17-59-47.a2r An on 20 1500 1000 500 3500 3000 Wavenumber (cm-1)
Please label and interpret the following IR spectra of an
unknown compound. Label each important absorption on the spectrum
with a structural feature of your unknown and identify the unknown
compound.
Method Name Default_Method User chem Date/Time 02/28/2019 5.59:47 PM Range:4000-500 Apodization:Happ-Genzel Sample ID:solomon Sample Scans 3 Background Scans. 16 Resolution:4 System Status:Good File Location: C:lUsers Public Documents AgilentiMicrolablResultsilsolomon_2019-02-28T17-59-47.a2r An on 20 1500 1000 500 3500 3000 Wavenumber (cm-1)
IR Worksheet 1. For each spectrum below: 1) Label the major peaks with their approximate frequency....
 IR Worksheet 1. For each spectrum below: 1) Label the major peaks with their approximate frequency. 2) Identify the bond vibration and possible functional group associated with each peak. 3) Match the spectra to one of these possible compounds: NH2 TRANSMITTANCE[%] pobo edo "2060 bo zdoo 160 Tobo 560 WAVENUMBER [cm-1] oot 08 TRANSMITTANCE [%] 09 01 02 4000 3500 3000 2500 2000 WAVENUMBER (cm-1] 1500 1000 500 οοο TRANSMITTANCE (6) οο οο οε 4000 3500 3000 1500 1000 2500...
compare the IR spectra of the alcohol and product and comment on the completion of the...
 compare the IR spectra of the alcohol and product and comment
on the completion of the reaction and purity of the product
collected
IR Spectra Alcohol lansmance 4000 3500 3000 1500 2500 2000 Wavenumbers (cm-1) 4000 3500 3000 2921.53 2500 Wavenumbers (cm-1) 2000 IR spectra product 1500 1444 44 1375 29 1000 1143.23 1039.81 916.32 797.83 423.62
compare the IR spectra of the alcohol and product and comment
on the completion of the reaction and purity of the product
collected
IR Spectra Alcohol lansmance 4000 3500 3000 1500 2500 2000 Wavenumbers (cm-1) 4000 3500 3000 2921.53 2500 Wavenumbers (cm-1) 2000 IR spectra product 1500 1444 44 1375 29 1000 1143.23 1039.81 916.32 797.83 423.62
Identify the peaks that identify the functional groups in the IR spectrum Unknown 9 C4H604 TRANSMITGAN...
 Identify the peaks that identify the functional groups
in the IR spectrum
Unknown 9 C4H604 TRANSMITGAN 1.001- 0 900- 0.800- 0.700- 0.600- 0.500- 0.400- 0 300- 0200- 0.100- 0.000-- - 4000 IR Unknown 2000 2500 3000 1500 1000 3500 Load IR spectrum Load proton NMR Show structure Spectra are displayed using Specview Website maintained by Mark Contact me at Jennifer muryka centre edu Unknown 21 C3H120 TRANSMIT GANCE 1.001- 0.900- 0 800- 0.700- 0.600- 0.500- 0.400 0.300- 0.200- 0.100- 0...
Identify the peaks that identify the functional groups
in the IR spectrum
Unknown 9 C4H604 TRANSMITGAN 1.001- 0 900- 0.800- 0.700- 0.600- 0.500- 0.400- 0 300- 0200- 0.100- 0.000-- - 4000 IR Unknown 2000 2500 3000 1500 1000 3500 Load IR spectrum Load proton NMR Show structure Spectra are displayed using Specview Website maintained by Mark Contact me at Jennifer muryka centre edu Unknown 21 C3H120 TRANSMIT GANCE 1.001- 0.900- 0 800- 0.700- 0.600- 0.500- 0.400 0.300- 0.200- 0.100- 0...
Label NMR spectra Esters: Ethyl acetate PERKIN ELMER 100.00 %T IR Spectrum(Thin Film) 0.00- 4000 3500...
 Label NMR spectra
Esters: Ethyl acetate
PERKIN ELMER 100.00 %T IR Spectrum(Thin Film) 0.00- 4000 3500 3000 2500 2000 1500 1000 cm: 588
Label NMR spectra
Esters: Ethyl acetate
PERKIN ELMER 100.00 %T IR Spectrum(Thin Film) 0.00- 4000 3500 3000 2500 2000 1500 1000 cm: 588
 Interpret the IR spectra for an unknown liquid substance.
Label all major bond types, and identify the
unknown substance.
The substance may be:
Acetone
Benzaldehyde
Diethyl Ether
Ethyl Acetate
Methanol
Methyl Benzoate
Toluene
1% "48000 3500 3000 2500 2000 1500 1000 600 cm-1
Interpret the IR spectra for an unknown liquid substance.
Label all major bond types, and identify the
unknown substance.
The substance may be:
Acetone
Benzaldehyde
Diethyl Ether
Ethyl Acetate
Methanol
Methyl Benzoate
Toluene
1% "48000 3500 3000 2500 2000 1500 1000 600 cm-1
 What IR Spectra is this?
The options are: Acetamide, Benzoic Acid, Benzophenone,
p-Aminobenzoic Acid, and Triphenyl Methanol
1% 4000 3500 3000 2500 2000 1500 1000 650 cm-1
What IR Spectra is this?
The options are: Acetamide, Benzoic Acid, Benzophenone,
p-Aminobenzoic Acid, and Triphenyl Methanol
1% 4000 3500 3000 2500 2000 1500 1000 650 cm-1
 Interpret the IR spectra for isoamyl acetate. Is the ester pure
or crude? Label major bond types.
101, 100 %T 40+ 4000 3500 3000 2500 cm-1 2000 1500 1000 600
Interpret the IR spectra for isoamyl acetate. Is the ester pure
or crude? Label major bond types.
101, 100 %T 40+ 4000 3500 3000 2500 cm-1 2000 1500 1000 600
 Identify this compound (label all major
functional groups on IR spectra).
SAMPLE 100- % TRANSMITTANCE 4000 1000 3500 3000 2000 1500 2500 WAVENUMBERS 600.1
Identify this compound (label all major
functional groups on IR spectra).
SAMPLE 100- % TRANSMITTANCE 4000 1000 3500 3000 2000 1500 2500 WAVENUMBERS 600.1
 Identify the peaks that identify the functional groups
in the IR spectrum
Unknown 4 C2H60 TRANSMITTANCE 1001- 0 900- 0 800- 0.700- 0.600- 0.500- 0.400- 0.300- 0200- 0.100- 0.000- 4000 IR Unknown 3500 3000 2500 2000 1000 1500 Load IR spectrum Load proton NMR Show structure Spectra are displayed using JSpecView Website maintained by Jennifer Muzyka Contact me at jennifer muzyka@centre edu. Unknown 5 C3H5NO TRANSMITTANCE 1.001 - 0.900- 0800- 0.700- 0.600- 0.500- 0.400- 0.300- 0 200- 0.100- 0 000...
Identify the peaks that identify the functional groups
in the IR spectrum
Unknown 4 C2H60 TRANSMITTANCE 1001- 0 900- 0 800- 0.700- 0.600- 0.500- 0.400- 0.300- 0200- 0.100- 0.000- 4000 IR Unknown 3500 3000 2500 2000 1000 1500 Load IR spectrum Load proton NMR Show structure Spectra are displayed using JSpecView Website maintained by Jennifer Muzyka Contact me at jennifer muzyka@centre edu. Unknown 5 C3H5NO TRANSMITTANCE 1.001 - 0.900- 0800- 0.700- 0.600- 0.500- 0.400- 0.300- 0 200- 0.100- 0 000...
 Please label and interpret the following IR spectra of an
unknown compound. Label each important absorption on the spectrum
with a structural feature of your unknown and identify the unknown
compound.
Method Name Default_Method User chem Date/Time 02/28/2019 5.59:47 PM Range:4000-500 Apodization:Happ-Genzel Sample ID:solomon Sample Scans 3 Background Scans. 16 Resolution:4 System Status:Good File Location: C:lUsers Public Documents AgilentiMicrolablResultsilsolomon_2019-02-28T17-59-47.a2r An on 20 1500 1000 500 3500 3000 Wavenumber (cm-1)
Please label and interpret the following IR spectra of an
unknown compound. Label each important absorption on the spectrum
with a structural feature of your unknown and identify the unknown
compound.
Method Name Default_Method User chem Date/Time 02/28/2019 5.59:47 PM Range:4000-500 Apodization:Happ-Genzel Sample ID:solomon Sample Scans 3 Background Scans. 16 Resolution:4 System Status:Good File Location: C:lUsers Public Documents AgilentiMicrolablResultsilsolomon_2019-02-28T17-59-47.a2r An on 20 1500 1000 500 3500 3000 Wavenumber (cm-1)
 IR Worksheet 1. For each spectrum below: 1) Label the major peaks with their approximate frequency. 2) Identify the bond vibration and possible functional group associated with each peak. 3) Match the spectra to one of these possible compounds: NH2 TRANSMITTANCE[%] pobo edo "2060 bo zdoo 160 Tobo 560 WAVENUMBER [cm-1] oot 08 TRANSMITTANCE [%] 09 01 02 4000 3500 3000 2500 2000 WAVENUMBER (cm-1] 1500 1000 500 οοο TRANSMITTANCE (6) οο οο οε 4000 3500 3000 1500 1000 2500...
 compare the IR spectra of the alcohol and product and comment
on the completion of the reaction and purity of the product
collected
IR Spectra Alcohol lansmance 4000 3500 3000 1500 2500 2000 Wavenumbers (cm-1) 4000 3500 3000 2921.53 2500 Wavenumbers (cm-1) 2000 IR spectra product 1500 1444 44 1375 29 1000 1143.23 1039.81 916.32 797.83 423.62
compare the IR spectra of the alcohol and product and comment
on the completion of the reaction and purity of the product
collected
IR Spectra Alcohol lansmance 4000 3500 3000 1500 2500 2000 Wavenumbers (cm-1) 4000 3500 3000 2921.53 2500 Wavenumbers (cm-1) 2000 IR spectra product 1500 1444 44 1375 29 1000 1143.23 1039.81 916.32 797.83 423.62
 Identify the peaks that identify the functional groups
in the IR spectrum
Unknown 9 C4H604 TRANSMITGAN 1.001- 0 900- 0.800- 0.700- 0.600- 0.500- 0.400- 0 300- 0200- 0.100- 0.000-- - 4000 IR Unknown 2000 2500 3000 1500 1000 3500 Load IR spectrum Load proton NMR Show structure Spectra are displayed using Specview Website maintained by Mark Contact me at Jennifer muryka centre edu Unknown 21 C3H120 TRANSMIT GANCE 1.001- 0.900- 0 800- 0.700- 0.600- 0.500- 0.400 0.300- 0.200- 0.100- 0...
Identify the peaks that identify the functional groups
in the IR spectrum
Unknown 9 C4H604 TRANSMITGAN 1.001- 0 900- 0.800- 0.700- 0.600- 0.500- 0.400- 0 300- 0200- 0.100- 0.000-- - 4000 IR Unknown 2000 2500 3000 1500 1000 3500 Load IR spectrum Load proton NMR Show structure Spectra are displayed using Specview Website maintained by Mark Contact me at Jennifer muryka centre edu Unknown 21 C3H120 TRANSMIT GANCE 1.001- 0.900- 0 800- 0.700- 0.600- 0.500- 0.400 0.300- 0.200- 0.100- 0...
 Label NMR spectra
Esters: Ethyl acetate
PERKIN ELMER 100.00 %T IR Spectrum(Thin Film) 0.00- 4000 3500 3000 2500 2000 1500 1000 cm: 588
Label NMR spectra
Esters: Ethyl acetate
PERKIN ELMER 100.00 %T IR Spectrum(Thin Film) 0.00- 4000 3500 3000 2500 2000 1500 1000 cm: 588
Most questions answered within 3 hours.
-
A baseball batter hits a 0.145kg baseball straight up into the
air. The baseball leaves the...
asked 6 minutes ago -
An FM modulator is tested using
single-tone baseband signal with frequency of 50kHz and a sprectrum...
asked 26 minutes ago -
Write the ionic equations for the first stage of salts
hydrolysis.
Anion, Cation?
Na2S
NiSO4
K2SO4...
asked 1 hour ago -
suppose there is a normally distributed population with a mean of
250 and a standard deviation...
asked 2 hours ago -
Question Three
Suppose you as project manager are using the Waterfall
development methodology on a large...
asked 3 hours ago -
Which statement is not true about welfare in Canada?
A.Benefits typically vary based on one's ability...
asked 4 hours ago -
Please help me with FLOWCHART and UML diagram for class,
thank you!
#include <iostream>
#include <fstream>...
asked 4 hours ago -
3. Describe the “logic circuit” of the Lac operon. Which
proteins are bound or not to...
asked 4 hours ago -
Ayesha’s adjusted gross income is $60,000 in 2019. She donated a
piece of artwork with a...
asked 5 hours ago -
For Dijkstra’s shortest path algorithm:
a. Give the Big-O time for Dijkstra’s shortest path algorithm
and...
asked 5 hours ago -
Phosphorus violates the 'octet rule' in biological molecules,
forming more covalent bonds than expected based on...
asked 5 hours ago -
A 1.3 eV electron has a 10-4 probability of tunneling
through a 2.4 eV potential barrier....
asked 5 hours ago