
Homework Answers


![>> P(Z <53) = 0.0139] (e) Less than 47 pounds The probability (a less than a P(x247) 47 pounds), 2-Score = 47-56.8 1.7253 5.6](http://img.homeworklib.com/questions/b19c4bc0-77f8-11ea-8839-0bf83ee2f17f.png?x-oss-process=image/resize,w_560)
Add Answer to:
that was an error. its no table for this question.
The Aluminum Association reports that the...
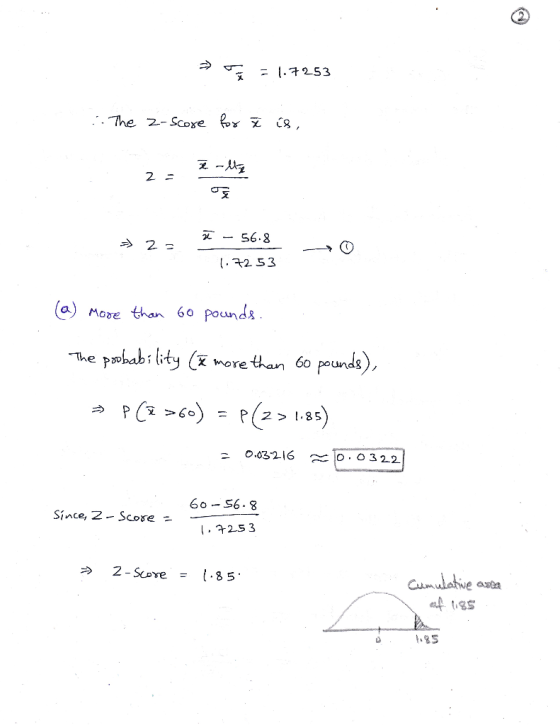
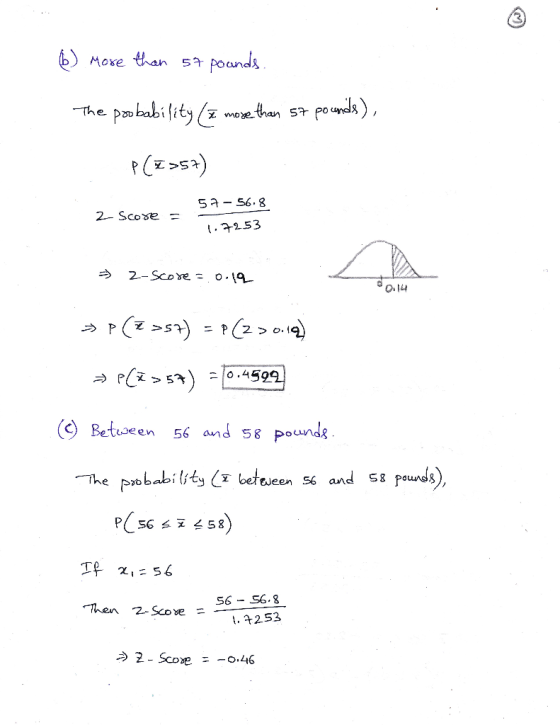
The Aluminum Association reports that the average American uses 56.8 pounds of aluminum in a year....
The Aluminum Association reports that the average American uses 56.8 pounds of aluminum in a year. A random sample of 50 households is monitored for one year to determine aluminum usage. If the population standard deviation of annual usage is 12.3 pounds, what is the probability that the sample mean will be each of the following? a. More than 58 pounds b. More than 56 pounds c. Between 55 and 58 pounds d. Less than 53 pounds e. Less than...
The Aluminum Association reports that the average American uses 56.8 pounds of aluminum in a year....
The Aluminum Association reports that the average American uses 56.8 pounds of aluminum in a year. A random sample of 50 households is monitored for one year to determine aluminum usage. If the population standard deviation of annual usage is 12.2 pounds, what is the probability that the sample mean will be each of the following? a. More than 61 pounds b. More than 57 pounds c. Between 55 and 57 pounds d. Less than 55 pounds e. Less than...
Statistics
The Aluminum Association reports that the average American uses 56.8 pounds of aluminum in a year. A random sample of 50 households is monitored for one year to determine aluminum usage. If the population standard deviation of annual usage is 12.2 pounds, what is the probability that the sample mean will be each of the following?Appendix A Statistical Tablesa. More than 61 poundsb. More than 56 poundsc. Between 55 and 57 poundsd. Less than 53 poundse. Less than 47 pounds
The Statistical Abstract of the United States published by the U.S. Census Bureau reports that the...
The Statistical Abstract of the United States published by the U.S. Census Bureau reports that the average annual consumption of fresh fruit per person is 99.9 pounds. The standard deviation of fresh fruit consumption is about 30 pounds. Suppose a researcher took a random sample of 38 people and had them keep a record of the fresh fruit they ate for one year. Appendix A Statistical Tables (Round all z values to 2 decimal places. Round your answers to 4...
You may need to use the appropriate table in Appendix B to answer this question. 9....
 You may need to use the appropriate table in Appendix B to answer this question. 9. (-/3 Points] DETAILS JKESTAT11 8.E. 119. MY NOTES ASK YOUR TEACHER The owner of a local chain of grocery stores is always trying to minimize the time it takes her customers to check out. In the past, she has conducted many studies of the checkout times, and they have displayed a normal distribution with a mean time of 12.2 minutes, and a standard deviation...
ociation bet i Data Table pretation of is as neede Student Study Time GPA on error....
 ociation bet i Data Table pretation of is as neede Student Study Time GPA on error. Skipped predict yig WN- QONOMN- nt of variabili GPA. % 00 O Print Done b. Find and interpret r. Use the interpretation of that refers to the prediction error and the percent of variability explained. 7- (Round to two decimal places as needed) 0 Interpret r in terms of the prediction error The overal prediction error using to predicty is than the prediction error...
Big babies: A government agency reports that 20% of baby boys 6 - 8 months old...
 Big babies: A government agency reports
that
20%
of baby boys
6
-
8
months old in the United States weigh more than
27
pounds. A sample of
150
babies is studied. Use the Cumulative Normal Distribution Table if
needed. Round the answer to at least four decimal places.
(a) Approximate the probability that less than
39
babies weigh more than
27
pounds.(b) Approximate the probability that
37
or fewer weigh more than
27
pounds.
(c) Approximate the probability that...
Big babies: A government agency reports
that
20%
of baby boys
6
-
8
months old in the United States weigh more than
27
pounds. A sample of
150
babies is studied. Use the Cumulative Normal Distribution Table if
needed. Round the answer to at least four decimal places.
(a) Approximate the probability that less than
39
babies weigh more than
27
pounds.(b) Approximate the probability that
37
or fewer weigh more than
27
pounds.
(c) Approximate the probability that...
West Battery Corp. has recently been receiving complaints from retailers that its 9-volt batteries are not...
 West Battery Corp. has recently been receiving complaints from retailers that its 9-volt batteries are not lasting as long as other name brands. James West, head of the TOM program at West's Austin plant, believes there is no problem because his batteries have had an average life of 60 hours, about 10% longer than competitors' models. To raise the time above this level would require a new level of technology not available to West. Nevertheless, he is concerned enough to...
ou may need to use the appropriate appendix table to answer this question. Suppose that the...
ou may need to use the appropriate appendix table to answer this question. Suppose that the mean daily viewing time of television is 8.35 hours. Use a normal probability distribution with a standard deviation of 2.5 hours to answer the following questions about daily television viewing per household a.How many hours of television viewing must a household have in order to be in the top 2% of all television viewing households? (Round your answer to two decimal places.) b.What is...
Question Help Regression was performed on test data for 49 car models to examine the association...
 Question Help Regression was performed on test data for 49 car models to examine the association between the weight of the car (in thousands of pounds) and the fuel efficiency (in miles per gallon). Complete parts (a) and (b). Click the icon to view the regression table a) Create a 95% confidence interval for the average fuel efficiency among cars weighing 2600 pounds, and explain what your interval means. The 95% confidence interval is (37.92 3930) (Round to two decimal...
 You may need to use the appropriate table in Appendix B to answer this question. 9. (-/3 Points] DETAILS JKESTAT11 8.E. 119. MY NOTES ASK YOUR TEACHER The owner of a local chain of grocery stores is always trying to minimize the time it takes her customers to check out. In the past, she has conducted many studies of the checkout times, and they have displayed a normal distribution with a mean time of 12.2 minutes, and a standard deviation...
 ociation bet i Data Table pretation of is as neede Student Study Time GPA on error. Skipped predict yig WN- QONOMN- nt of variabili GPA. % 00 O Print Done b. Find and interpret r. Use the interpretation of that refers to the prediction error and the percent of variability explained. 7- (Round to two decimal places as needed) 0 Interpret r in terms of the prediction error The overal prediction error using to predicty is than the prediction error...
 Big babies: A government agency reports
that
20%
of baby boys
6
-
8
months old in the United States weigh more than
27
pounds. A sample of
150
babies is studied. Use the Cumulative Normal Distribution Table if
needed. Round the answer to at least four decimal places.
(a) Approximate the probability that less than
39
babies weigh more than
27
pounds.(b) Approximate the probability that
37
or fewer weigh more than
27
pounds.
(c) Approximate the probability that...
Big babies: A government agency reports
that
20%
of baby boys
6
-
8
months old in the United States weigh more than
27
pounds. A sample of
150
babies is studied. Use the Cumulative Normal Distribution Table if
needed. Round the answer to at least four decimal places.
(a) Approximate the probability that less than
39
babies weigh more than
27
pounds.(b) Approximate the probability that
37
or fewer weigh more than
27
pounds.
(c) Approximate the probability that...
 West Battery Corp. has recently been receiving complaints from retailers that its 9-volt batteries are not lasting as long as other name brands. James West, head of the TOM program at West's Austin plant, believes there is no problem because his batteries have had an average life of 60 hours, about 10% longer than competitors' models. To raise the time above this level would require a new level of technology not available to West. Nevertheless, he is concerned enough to...
 Question Help Regression was performed on test data for 49 car models to examine the association between the weight of the car (in thousands of pounds) and the fuel efficiency (in miles per gallon). Complete parts (a) and (b). Click the icon to view the regression table a) Create a 95% confidence interval for the average fuel efficiency among cars weighing 2600 pounds, and explain what your interval means. The 95% confidence interval is (37.92 3930) (Round to two decimal...
Most questions answered within 3 hours.
-
A regression equation that describes the relationship between
the amount of the bill ($) at a...
asked 36 minutes ago -
exercise on VSEPR and molecular structrue.
octahedral
SeCl62-
TeCl62-
ClF62-
distorted
SeF62–
IF6–
asked 1 hour ago -
284 mL of a 0.52 M potassium hydroxide solution is added to 467
mL of a...
asked 1 hour ago -
Little’s Law: Val d’Costa is a world famous ski village in the
French Alps. Because of...
asked 1 hour ago -
Find the absolute error D for the calculation if A + B/C=D A=
9.4 +/- 0.4...
asked 2 hours ago -
New Air Heating and Cooling, manufactures furnaces and central
air units. The company pride itself on...
asked 2 hours ago -
A coach uses a new technique to train gymnasts. Seven
gymnasts were randomly selected and their...
asked 4 hours ago -
While rotating the tires on your car you notice a rock [mass =
0.1 Kg] stuck...
asked 6 hours ago -
Using MARS simulator, write MIPS programs according to
the following scenarios: Receive a positive integer number...
asked 8 hours ago -
An object in front of a concave mirror has a real image that is
11.5 cm...
asked 8 hours ago -
Consider the reaction, C3 H8 + O2 --> CO2 + H2O. How many
moles of O2...
asked 10 hours ago -
You and your opponent both roll a fair die. If you both roll the
same number,...
asked 10 hours ago