
Homework Answers
Option 3 - 7 quarters
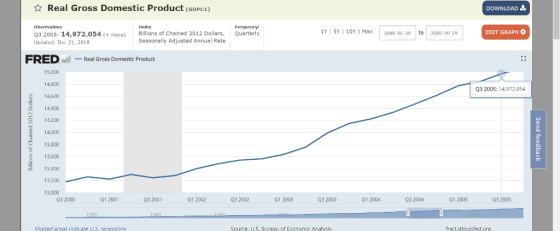
As can be seen from the picture, that it took almost 7 quarters for the real GDP to rise 2% above its local peak. The real GDP in Q4 2000 is around 13260 and 2% of it would mean 265 and an increase of 265 means the real GDP becomes13525. Hence in Q3 2002 it is more than 13525 and it takes 7 quarters to rise 2%.
Add Answer to:
Question 15 0.1 pts Go the FRED website, then find and download Real GDP (Quarterly, Seasonally...
(1) Playing with data: Download quarterly, seasonally adjusted data on US real GDP, personal cons...
(1) Playing with data: Download quarterly, seasonally adjusted data on US real GDP, personal consumption expenditures, and gross private domestic investment for the period 1947q1 - 2010q2. You can download these series from the Bureau of Economic Analysis (BEA) or the St. Louis Fed FRED database. (a) Take the natural logarithm of each series (ì=ln(series)î in Excel) and plot each against time. Which series appears to move around the most? Which series appears to move around the least? (b) The...
Question 2 The following table shows quarterly data of U.S. nominal and real GDP in 2018....
 Question 2 The following table shows quarterly data of U.S. nominal and real GDP in 2018. Use the information to calculate items (a), (b), and (c): 2018 01 20,04120,411.9 02 | 03 20,658.2 18,511.6 18,665 Nominal GDP (billions of dollars Real GDP (billions of 2012 dollars)18,3241 a. (2 points) Calculate the growth rate of nominal GDP in second and third quarters of b. (2 points) Calculate the growth rate of real GDP in second and third quarters of 2018. 2018....
2. Download the annual real GDP and GDP data of the United States 1950-2018 from FRED....
 2. Download the annual real GDP and GDP data of the United States 1950-2018 from FRED. For the real GDP, the data online is chain-weighted and uses 2012 as the base year. In the lecture hursday, I showed you the detailed method and calculated the new chain-weighted real GDP when 1990 is the base year. You are required to calculate a new sequence of chain- weighted real GDP given a new base-year. The base year you should use in your...
• 1. What are the quarterly growth rates (Percentage Change From Preceding Period in Real Gross...
 • 1. What are the quarterly growth rates (Percentage Change From Preceding Period in Real Gross Domestic Product) for the U.S. economy for the last six quarters? Report those numbers in your submission 2. What is the average of those 6 quarters? . 3. Is the average of those growth rates above or below the long-run U.S. annual growth rate of 3.5 percent? Bureau of Economke Analysis Table 1.1.1. Percent Change From Preceding Period in Real Gross Domestic Product Percent...
**This question has been asked and answered once already with OLD data, please note you will...
 **This question has been asked and answered once already
with OLD data, please note you will need to visit the website below
as stated in the question or go by the table/chart provided at the
bottom**
Visit the Bureau of Economics Analysis website at www.bea.gov. From
the drop-down menu under "Data", click on "by Economics Account".
Then click on "National", "Gross Domestic Product" and "Full
Release and Tables". Use table 3 (Gross Domestic Product: Level and
Change from Preceding Period)....
**This question has been asked and answered once already
with OLD data, please note you will need to visit the website below
as stated in the question or go by the table/chart provided at the
bottom**
Visit the Bureau of Economics Analysis website at www.bea.gov. From
the drop-down menu under "Data", click on "by Economics Account".
Then click on "National", "Gross Domestic Product" and "Full
Release and Tables". Use table 3 (Gross Domestic Product: Level and
Change from Preceding Period)....
1. Exercise 5.1 The forecasting staff for the Prizer Corporation has developed a model to predict...
 1. Exercise 5.1 The forecasting staff for the Prizer Corporation has developed a model to predict sales of its air-cushioned-ride snowmobiles. The model specifies that sales, S, vary jointly with disposable personal income, Y, and the population between ages 15 and 40,Z, and inversely with the price of the snowmobiles, P. Based on past data, the best estimate of this relationship is: where k has been estimated (from past data) to equal 100 If Y $13,000, Z- $1,200, and P...
4. Perform a SWOT analysis for Fitbit. Based on your assessment of these, what are some strategic options for Fitbit go...
 4. Perform a SWOT analysis for Fitbit. Based on your
assessment of these, what are some strategic options for Fitbit
going forward?
5. Analyze the company’s financial performance. Do trends
suggest that Fitbit’s strategy is working?
6.What recommendations would you make to Fitbit management to
address the most important strategic issues facing the
company?
Fitbit, Inc., in 2017: Can Revive Its Strategy and It Reverse Mounting Losses? connect ROCHELLE R. BRUNSON Baylor University MARLENE M. REED Baylor University in the...
4. Perform a SWOT analysis for Fitbit. Based on your
assessment of these, what are some strategic options for Fitbit
going forward?
5. Analyze the company’s financial performance. Do trends
suggest that Fitbit’s strategy is working?
6.What recommendations would you make to Fitbit management to
address the most important strategic issues facing the
company?
Fitbit, Inc., in 2017: Can Revive Its Strategy and It Reverse Mounting Losses? connect ROCHELLE R. BRUNSON Baylor University MARLENE M. REED Baylor University in the...
 Question 2 The following table shows quarterly data of U.S. nominal and real GDP in 2018. Use the information to calculate items (a), (b), and (c): 2018 01 20,04120,411.9 02 | 03 20,658.2 18,511.6 18,665 Nominal GDP (billions of dollars Real GDP (billions of 2012 dollars)18,3241 a. (2 points) Calculate the growth rate of nominal GDP in second and third quarters of b. (2 points) Calculate the growth rate of real GDP in second and third quarters of 2018. 2018....
 2. Download the annual real GDP and GDP data of the United States 1950-2018 from FRED. For the real GDP, the data online is chain-weighted and uses 2012 as the base year. In the lecture hursday, I showed you the detailed method and calculated the new chain-weighted real GDP when 1990 is the base year. You are required to calculate a new sequence of chain- weighted real GDP given a new base-year. The base year you should use in your...
 • 1. What are the quarterly growth rates (Percentage Change From Preceding Period in Real Gross Domestic Product) for the U.S. economy for the last six quarters? Report those numbers in your submission 2. What is the average of those 6 quarters? . 3. Is the average of those growth rates above or below the long-run U.S. annual growth rate of 3.5 percent? Bureau of Economke Analysis Table 1.1.1. Percent Change From Preceding Period in Real Gross Domestic Product Percent...
 **This question has been asked and answered once already
with OLD data, please note you will need to visit the website below
as stated in the question or go by the table/chart provided at the
bottom**
Visit the Bureau of Economics Analysis website at www.bea.gov. From
the drop-down menu under "Data", click on "by Economics Account".
Then click on "National", "Gross Domestic Product" and "Full
Release and Tables". Use table 3 (Gross Domestic Product: Level and
Change from Preceding Period)....
**This question has been asked and answered once already
with OLD data, please note you will need to visit the website below
as stated in the question or go by the table/chart provided at the
bottom**
Visit the Bureau of Economics Analysis website at www.bea.gov. From
the drop-down menu under "Data", click on "by Economics Account".
Then click on "National", "Gross Domestic Product" and "Full
Release and Tables". Use table 3 (Gross Domestic Product: Level and
Change from Preceding Period)....
 1. Exercise 5.1 The forecasting staff for the Prizer Corporation has developed a model to predict sales of its air-cushioned-ride snowmobiles. The model specifies that sales, S, vary jointly with disposable personal income, Y, and the population between ages 15 and 40,Z, and inversely with the price of the snowmobiles, P. Based on past data, the best estimate of this relationship is: where k has been estimated (from past data) to equal 100 If Y $13,000, Z- $1,200, and P...
 4. Perform a SWOT analysis for Fitbit. Based on your
assessment of these, what are some strategic options for Fitbit
going forward?
5. Analyze the company’s financial performance. Do trends
suggest that Fitbit’s strategy is working?
6.What recommendations would you make to Fitbit management to
address the most important strategic issues facing the
company?
Fitbit, Inc., in 2017: Can Revive Its Strategy and It Reverse Mounting Losses? connect ROCHELLE R. BRUNSON Baylor University MARLENE M. REED Baylor University in the...
4. Perform a SWOT analysis for Fitbit. Based on your
assessment of these, what are some strategic options for Fitbit
going forward?
5. Analyze the company’s financial performance. Do trends
suggest that Fitbit’s strategy is working?
6.What recommendations would you make to Fitbit management to
address the most important strategic issues facing the
company?
Fitbit, Inc., in 2017: Can Revive Its Strategy and It Reverse Mounting Losses? connect ROCHELLE R. BRUNSON Baylor University MARLENE M. REED Baylor University in the...
Most questions answered within 3 hours.
-
Angel Corporation has $10,000,000 of
8.0% 25 year bonds dated May 1, 2018 with interest payable...
asked 30 minutes ago -
7.
________ involves individuals trading goods they already have or
providing services in exchange for something...
asked 34 minutes ago -
Share your research problem. What databases did you search as
you gathered evidence to support your...
asked 34 minutes ago -
what process occurs to form microspores and megaspores in flowering
plants?
asked 41 minutes ago -
C++
I need to use the function getData to put in all my data using
arrays....
asked 41 minutes ago -
A block is hung by a string from the inside roof of a van. When
the...
asked 48 minutes ago -
Do you think companies should not go for long term debt in their
capital structure to...
asked 56 minutes ago -
I create an address book where the user enters the name, phone
and email in the...
asked 1 hour ago -
The production capacity for acrylonitrile
(C3H3N) in the United States exceeds 2
million pounds per year....
asked 1 hour ago -
explain and comment out your answer
43. How many address lines are required to address a...
asked 1 hour ago -
A sample of 45 observations is selected from a normal
population. The sample mean is 49,...
asked 1 hour ago -
A construction company is planning to bid on a building
contract. The bid costs the company...
asked 1 hour ago