Chapter 10 If a random sample of 30 homes south of Center Street in Provo has...
Chapter 10
If a random sample of 30 homes south of Center Street in Provo has a mean selling price of $145,325 and a standard deviation of $4850, and a random sample of 26 homes north of Center Street has a mean selling price of $148,675 and a standard deviation of $5600, can you conclude that there is a significant difference between the selling price of homes in these two areas of Provo at the 0.05 level? Assume normality.
(a) Find t. (Give your answer correct to two decimal places.)
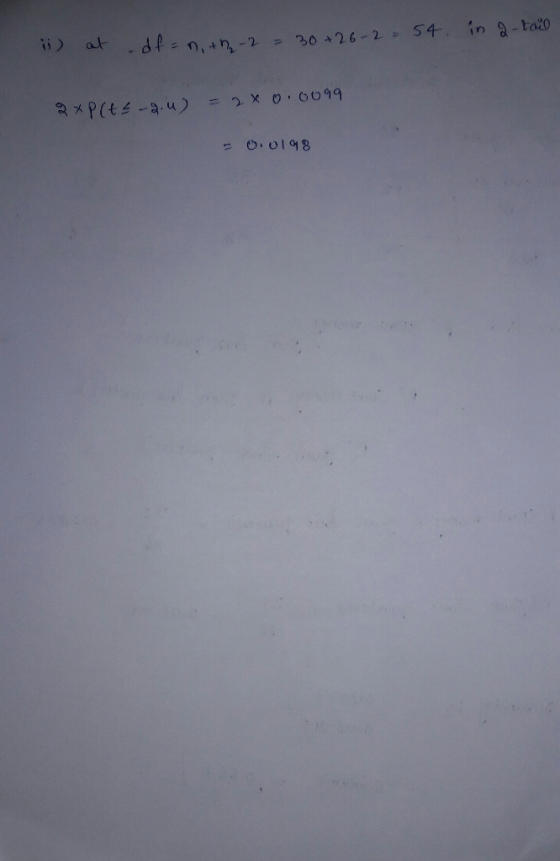
(ii) Find the p-value. (Give your answer correct to four decimal places.)
Homework Answers
For unknown sigma we use t distribution.. here we use 2 sample t test..
Test statistic t=( x1-x2)/ sp × sqrt( (1/n1)+(1/n2))
And find p value at df= n1+n2-2 in 2 tail

Add Answer to:
Chapter 10
If a random sample of 30 homes south of Center Street in Provo
has...
If a random sample of 16 homes south of Center Street in Provo has a mean...
If a random sample of 16 homes south of Center Street in Provo has a mean selling price of $145,250 and a standard deviation of $4650, and a random sample of 17 homes north of Center Street has a mean selling price of $148,475 and a standard deviation of $5750, can you conclude that there is a significant difference between the selling price of homes in these two areas of Provo at the 0.05 level? Assume normality. (a) Find t....
A random sample of size 39 is to be selected from a population that has a...
A random sample of size 39 is to be selected from a population that has a mean μ = 53 and a standard deviation σ of 15. (a) This sample of 39 has a mean value of x, which belongs to a sampling distribution. Find the shape of this sampling distribution. -skewed right -approximately normal -skewed left -chi-square (b) Find the mean of this sampling distribution. (Give your answer correct to nearest whole number.) (c) Find the standard error of...
A random sample of size 32 is to be selected from a population that has a...
A random sample of size 32 is to be selected from a population that has a mean μ = 48 and a standard deviation σ of 13. (a) This sample of 32 has a mean value of x, which belongs to a sampling distribution. Find the shape of this sampling distribution. skewed right approximately normal skewed left chi-square (b) Find the mean of this sampling distribution. (Give your answer correct to nearest whole number.) (c) Find the standard error of...
A simple random sample of 30 items resulted in a sample mean of 10
A simple random sample of 30 items resulted in a sample mean of 10. The population standard deviation is σ = 9. Round your answers to two decimal places. a. What is the standard error of the mean, σx̅? b. At 95% confidence, what is the margin of error?
A random sample of size n= 15 obtained from a population that is normally distributed results...
 A random sample of size n= 15 obtained from a population that is normally distributed results in a sample mean of 45.8 and sample standard deviation 12.2. An independent sample of size n = 20 obtained from a population that is normally distributed results in a sample mean of 51.9 and sample standard deviation 14.6. Does this constitute sufficient evidence to conclude that the population means differ at the a = 0.05 level of significance? Click here to view the...
Fairfield Homes is developing two parcels near Pigeon Forge, Tennessee. In order to test different advertising...
 Fairfield Homes is developing two parcels near Pigeon Forge, Tennessee. In order to test different advertising approaches, it uses different media to reach potential buyers. The mean annual family income for 15 people making inquiries at the first development is $150,000, with a standard deviation of $40,000. A corresponding sample of 25 people at the second development had a mean of $180,000, with a standard deviation of $30,000. Assume the population standard deviations are the same. At the 0.05 significance...
Suppose a random sample of n = 25 observations is selected from a population that is...
Suppose a random sample of n = 25 observations is selected from a population that is normally distributed with mean equal to 106 and standard deviation equal to 15. (a) Give the mean and the standard deviation of the sampling distribution of the sample mean x̄. mean= standard deviation= (b) Find the probability that x̄ exceeds 115. (Round your answer to four decimal places.) (c) Find the probability that the sample mean deviates from the population mean μ...
A random sample of 15 night students was taken with a sample mean GPA of 2.82...
 A random sample of 15 night students was taken with a sample mean GPA of 2.82 and a standard deviation of 0.05. A random sample of 17 day students was taken with a sample mean GPA of 2.79 and a standard deviation of 0.07. Test the claim that the mean GPA of night students (un) is greater than than the mean GPA of day students (up) at a = 0.10. Assume that the data come from normal populations with unequal...
A random sample of 49 measurements from one population had a sample mean of 10, with...
A random sample of 49 measurements from one population had a sample mean of 10, with sample standard deviation 3. An independent random sample of 64 measurements from a second population had a sample mean of 12, with sample standard deviation 4. Test the claim that the population means are different. Use level of significance 0.01. (c) Compute x1 − x2. x1 − x2 = Compute the corresponding sample distribution value. (Test the difference μ1 − μ2. Round your answer...
Chapter IU! Hypothesis Testing Exercises (1): A random sample of 6 steel beams has a mean...
 Chapter IU! Hypothesis Testing Exercises (1): A random sample of 6 steel beams has a mean com- pressive strength of 58,392 psi (pounds per square inch) with a standard deviation of 648 psi. Use this information and the level of significance a = 0.05 to test whether the true average compressive strength of the steel from which this sample came is 58,000 psi. Assume normality. Roelve the show verrien ifn-en 5. tereo Head Exercises (2): Studying the flow of traffic...
 A random sample of size n= 15 obtained from a population that is normally distributed results in a sample mean of 45.8 and sample standard deviation 12.2. An independent sample of size n = 20 obtained from a population that is normally distributed results in a sample mean of 51.9 and sample standard deviation 14.6. Does this constitute sufficient evidence to conclude that the population means differ at the a = 0.05 level of significance? Click here to view the...
 Fairfield Homes is developing two parcels near Pigeon Forge, Tennessee. In order to test different advertising approaches, it uses different media to reach potential buyers. The mean annual family income for 15 people making inquiries at the first development is $150,000, with a standard deviation of $40,000. A corresponding sample of 25 people at the second development had a mean of $180,000, with a standard deviation of $30,000. Assume the population standard deviations are the same. At the 0.05 significance...
 A random sample of 15 night students was taken with a sample mean GPA of 2.82 and a standard deviation of 0.05. A random sample of 17 day students was taken with a sample mean GPA of 2.79 and a standard deviation of 0.07. Test the claim that the mean GPA of night students (un) is greater than than the mean GPA of day students (up) at a = 0.10. Assume that the data come from normal populations with unequal...
 Chapter IU! Hypothesis Testing Exercises (1): A random sample of 6 steel beams has a mean com- pressive strength of 58,392 psi (pounds per square inch) with a standard deviation of 648 psi. Use this information and the level of significance a = 0.05 to test whether the true average compressive strength of the steel from which this sample came is 58,000 psi. Assume normality. Roelve the show verrien ifn-en 5. tereo Head Exercises (2): Studying the flow of traffic...
Most questions answered within 3 hours.
-
lease solve all the
questions, don't need to explanations
Q1 - All animal
species have general...
asked 1 hour ago -
Business Phasing
1.Discuss the logical progression for growing a business, which
starts from the initial idea...
asked 1 hour ago -
Modify
When executing on the command line having only
this program name, the program will accept...
asked 2 hours ago -
Kenny Electric Company's noncallable bonds were issued several
years ago and now have 20 years to...
asked 3 hours ago -
find H(e^Jtheta) at theta= 0, pi/10, pi/20, pi/2 for
the following:
a) H(e^Jtheta)= 1+e^Jtheta
b) H(e^Jtheta)=...
asked 3 hours ago -
Home Corporation will open a new store on January 1. Based on
experience from its other...
asked 3 hours ago -
In a neoclassical model, use the IS-LM to analyze the effect of
a permanent money supply...
asked 4 hours ago -
An electron passes through a point 2.67 cm from a long straight
wire as it moves...
asked 5 hours ago -
A grammar is a 4-tuple G, G = (Ν, Σ, Π, Σ, S) where, Ν is...
asked 5 hours ago -
In this part, calculate the present values. Use the Excel PV
function to compute the present...
asked 5 hours ago -
Part 1. Primitive Types, Sorting, Recursion for
Homework.java
a) Implement the static method initializeArray that receives...
asked 6 hours ago -
Using C++, build a sorter that can rank a sequence of numbers in
a descending order....
asked 6 hours ago