
Homework Answers
(a)
Following is the frequency distribution of "Number bitten":
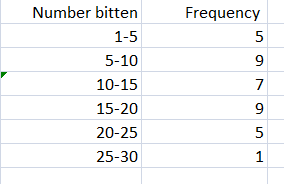
Following is the histogram:

There are 36 data values so midpoint will be average of 18th and 19th data value. Since 18th and 19th data values are 13 and 13 respectively so midpoint is 13.
(b)
Following is the time series plot:
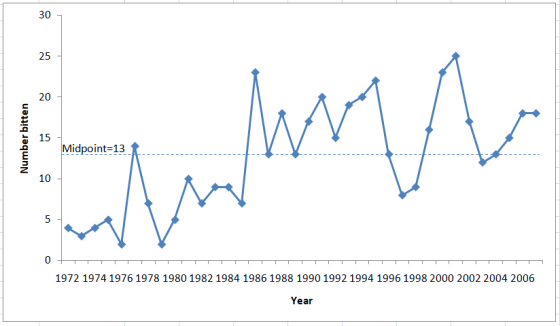
Out of 22 years, 15 had more people bitten by alligators than your midpoint.
Add Answer to:
2.5. Here are data on the number of people bitten by alligators in Florida over a...
The data set on the right contains the real per capita GDP for 2 countries from the Penn World Table (PWT) version 9.1 (Feenstra et al., 2015). The column names are the country codes, OMN and PSE. You may copy the dataset to Excel or R to do the computati
 YearOMN197011266197176221972632319735051197473381975802219768360197793611978965919791092719801149919811280319821276619831242319841306419851403219861019219871005419888809198992381990105911991991819921026319931004519949747199510199199611054199711784199811560199913501200016173200116853200218508200320329200425768200526647200638458200740960200847136200938538201040305201144477201247334201344979201440855201532460201629939201728249
The precipitations in Sherbrooke have been recorded from 1962 to 2007 Total Precipitation 1132,7 1090,2 911,6...
 The precipitations in Sherbrooke have been recorded from 1962 to 2007 Total Precipitation 1132,7 1090,2 911,6 899,9 895,8 1311,5 1095,5 927 1196.3 295,3 1299.1 1155,3 1055,5 960,4 1051,7 1079 881,5 895,5 1173,5 1011 1184.6 1289 1188 Total Precipitation Year 1985 1986 1987 1988 1989 1990 1991 Year 1963 1964 1965 1966 1967 1968 1969 1970 1971 1972 1973 1974 1975 1976 1977 1978 1979 1980 1981 1982 1983 1984 952,7 943.2 854.1 944,5 969.6 1034,3 1088,5 247,7 1040,2 1153,6 1281,2...
Listed below are the numbers of people who have been executed in the US in each...
Listed below are the numbers of people who have been executed in the US in each year from 1976 (the year the US Supreme court’s decision allowing the death penalty to be carried out) to 1994. Use the data to create a chart of execution per year. How has the number of execution varied since 1976? (using excel) Year Number of executions Year Number of executions 1976 0 1986 18 1977 1 1987 25 1978 0 1988 11 1979 2...
11.14 The peak-flow data on an annual basis from Cedar River near Austin, MN, are listed...
 11.14 The peak-flow data on an annual basis from Cedar River near Austin, MN, are listed in the following table. Plot the flood-frequency curve on lognormal probability paper. Determine the (a) magnitude of a flood having a return period of 100 years (probability of 1%), and (b) probability of a flow of 100 cfs. Peak- flow cfs 7750 5440 Peak- flow cfs Peak- flow cfs Peak- flow cfs Year Year Year 1991 979 3880 2003 8690 1992 2004 3580 1993...
Because the Florida manatee population is threatened, the Florida Maatee Sanctuary Act of 1978 was enacted...
 Because the Florida manatee population is threatened, the Florida Maatee Sanctuary Act of 1978 was enacted to protect the species. Scientists interested in the relationship between the number of manatee deaths and time collected the data shown in the table. Manatee Deaths 174 163 146 192 201 416 242 232 269 272 325 305 380 276 396 416 Manatee Deaths Year 1974 1975 1976 1977 1978 1979 1980 1981 1982 1983 1984 1985 1986 1987 1988 1989 1990 Year 1991...
Based on the above table answer the following questions; What year is the base year? (15) ...
 Based on the above table answer the following
questions;
What year is the base
year?
(15)
__________________________________________
In which year, did we experience deflation?
(15)
______________________________
What was the rate of inflation between 1970 and 1980?
(15) ________________________
If you earned $10,000 in 1990, how much would you have
had to earn in 2016 in order to maintain the same purchasing power?
(5) ___________________________________
Table 4.3 1970 - 2018 Consumer Price Index for All Urban Consumers Price Price Price Price...
Based on the above table answer the following
questions;
What year is the base
year?
(15)
__________________________________________
In which year, did we experience deflation?
(15)
______________________________
What was the rate of inflation between 1970 and 1980?
(15) ________________________
If you earned $10,000 in 1990, how much would you have
had to earn in 2016 in order to maintain the same purchasing power?
(5) ___________________________________
Table 4.3 1970 - 2018 Consumer Price Index for All Urban Consumers Price Price Price Price...
FIREARM DEATHS Download the Excel file Firearm.xls for use in this question. The number of deaths...
 FIREARM DEATHS Download the Excel file Firearm.xls for use in
this question. The number of deaths due to firearms in the United
States between 1968 and 1993 are given in the Excel file.
Answer the following using the research hypothesis, "there is a
correlation between year and number of firearm deaths in the
US."
A. What is the value of the correlation coefficient between
year and number of firearm deaths? (Answer to 3 decimal
places)
B. How many degrees of freedom...
FIREARM DEATHS Download the Excel file Firearm.xls for use in
this question. The number of deaths due to firearms in the United
States between 1968 and 1993 are given in the Excel file.
Answer the following using the research hypothesis, "there is a
correlation between year and number of firearm deaths in the
US."
A. What is the value of the correlation coefficient between
year and number of firearm deaths? (Answer to 3 decimal
places)
B. How many degrees of freedom...
~~~~~~~~~~~~TO BE COMPLETED USING RSTUDIO~~~~~~~~~~~~~~ ~~~~~~~~~~~~(Please display all RCode used)~~~~~~~~~~~~~~ Regression Is there a relationship between...
~~~~~~~~~~~~TO BE COMPLETED USING RSTUDIO~~~~~~~~~~~~~~ ~~~~~~~~~~~~(Please display all RCode used)~~~~~~~~~~~~~~ Regression Is there a relationship between the number of stories a building has and its height? Some statisticians compiled data on a set of n = 60 buildings reported in the World Almanac. You will use the data set to decide whether height (in feet) can be predicted from the number of stories. (a) Load the data from buildings.txt. (Note that this is a text file, so use the appropriate...
HYPOTHESIS TESTING Climate change is a topic of both academic and political interest. The Nationa...
HYPOTHESIS TESTING Climate change is a topic of both academic and political interest. The National Climatic Data Center has recorded temperature data since 1800. You can explore their data at: http://data.giss.nasa.gov/gistemp/ The following chart compares the average Land-Surface Air Temperatures for year since 1961 to the 20th century average Land-Surface Air Temperature. Year Temp Change, °C 1961 0.075 1962 0.038 1963 0.079 1964 -0.207 1965 -0.111 1966 -0.031 1967 -0.005 1968 -0.044 1969 0.076 1970 0.028 1971 -0.105 1972 0.001...
Please check out these directions before the pictures! I hope someone is able to help! Thank...
 Please check out these directions before the pictures! I hope
someone is able to help! Thank you!
11.14 Empirical method. Plot (Q vs. P)data.
Correction to (b) probability of a flow of 1000 cfs
11.15 Use theoretical method (frequency factor).
Plot the flood-freq. curve (Q vs. P)theory.
+ Repeat (a) and (b) in Prob. 11.14.
These are the answers BEFROE using the constraints listed
above. I thought I’d include them as a reference.
rhe neak-flow data on an annual basis...
Please check out these directions before the pictures! I hope
someone is able to help! Thank you!
11.14 Empirical method. Plot (Q vs. P)data.
Correction to (b) probability of a flow of 1000 cfs
11.15 Use theoretical method (frequency factor).
Plot the flood-freq. curve (Q vs. P)theory.
+ Repeat (a) and (b) in Prob. 11.14.
These are the answers BEFROE using the constraints listed
above. I thought I’d include them as a reference.
rhe neak-flow data on an annual basis...
 The precipitations in Sherbrooke have been recorded from 1962 to 2007 Total Precipitation 1132,7 1090,2 911,6 899,9 895,8 1311,5 1095,5 927 1196.3 295,3 1299.1 1155,3 1055,5 960,4 1051,7 1079 881,5 895,5 1173,5 1011 1184.6 1289 1188 Total Precipitation Year 1985 1986 1987 1988 1989 1990 1991 Year 1963 1964 1965 1966 1967 1968 1969 1970 1971 1972 1973 1974 1975 1976 1977 1978 1979 1980 1981 1982 1983 1984 952,7 943.2 854.1 944,5 969.6 1034,3 1088,5 247,7 1040,2 1153,6 1281,2...
 11.14 The peak-flow data on an annual basis from Cedar River near Austin, MN, are listed in the following table. Plot the flood-frequency curve on lognormal probability paper. Determine the (a) magnitude of a flood having a return period of 100 years (probability of 1%), and (b) probability of a flow of 100 cfs. Peak- flow cfs 7750 5440 Peak- flow cfs Peak- flow cfs Peak- flow cfs Year Year Year 1991 979 3880 2003 8690 1992 2004 3580 1993...
 Because the Florida manatee population is threatened, the Florida Maatee Sanctuary Act of 1978 was enacted to protect the species. Scientists interested in the relationship between the number of manatee deaths and time collected the data shown in the table. Manatee Deaths 174 163 146 192 201 416 242 232 269 272 325 305 380 276 396 416 Manatee Deaths Year 1974 1975 1976 1977 1978 1979 1980 1981 1982 1983 1984 1985 1986 1987 1988 1989 1990 Year 1991...
 Based on the above table answer the following
questions;
What year is the base
year?
(15)
__________________________________________
In which year, did we experience deflation?
(15)
______________________________
What was the rate of inflation between 1970 and 1980?
(15) ________________________
If you earned $10,000 in 1990, how much would you have
had to earn in 2016 in order to maintain the same purchasing power?
(5) ___________________________________
Table 4.3 1970 - 2018 Consumer Price Index for All Urban Consumers Price Price Price Price...
Based on the above table answer the following
questions;
What year is the base
year?
(15)
__________________________________________
In which year, did we experience deflation?
(15)
______________________________
What was the rate of inflation between 1970 and 1980?
(15) ________________________
If you earned $10,000 in 1990, how much would you have
had to earn in 2016 in order to maintain the same purchasing power?
(5) ___________________________________
Table 4.3 1970 - 2018 Consumer Price Index for All Urban Consumers Price Price Price Price...
 FIREARM DEATHS Download the Excel file Firearm.xls for use in
this question. The number of deaths due to firearms in the United
States between 1968 and 1993 are given in the Excel file.
Answer the following using the research hypothesis, "there is a
correlation between year and number of firearm deaths in the
US."
A. What is the value of the correlation coefficient between
year and number of firearm deaths? (Answer to 3 decimal
places)
B. How many degrees of freedom...
FIREARM DEATHS Download the Excel file Firearm.xls for use in
this question. The number of deaths due to firearms in the United
States between 1968 and 1993 are given in the Excel file.
Answer the following using the research hypothesis, "there is a
correlation between year and number of firearm deaths in the
US."
A. What is the value of the correlation coefficient between
year and number of firearm deaths? (Answer to 3 decimal
places)
B. How many degrees of freedom...
 Please check out these directions before the pictures! I hope
someone is able to help! Thank you!
11.14 Empirical method. Plot (Q vs. P)data.
Correction to (b) probability of a flow of 1000 cfs
11.15 Use theoretical method (frequency factor).
Plot the flood-freq. curve (Q vs. P)theory.
+ Repeat (a) and (b) in Prob. 11.14.
These are the answers BEFROE using the constraints listed
above. I thought I’d include them as a reference.
rhe neak-flow data on an annual basis...
Please check out these directions before the pictures! I hope
someone is able to help! Thank you!
11.14 Empirical method. Plot (Q vs. P)data.
Correction to (b) probability of a flow of 1000 cfs
11.15 Use theoretical method (frequency factor).
Plot the flood-freq. curve (Q vs. P)theory.
+ Repeat (a) and (b) in Prob. 11.14.
These are the answers BEFROE using the constraints listed
above. I thought I’d include them as a reference.
rhe neak-flow data on an annual basis...
Most questions answered within 3 hours.
-
Convert the high level language programming statementts to 80x86
assembly, Assume X=AX and y=BX
for (i=1;...
asked 3 minutes ago -
SoleMate’s Burkins sneakers cost $40 per pair from the supplier
and are sold by SoleMate at...
asked 7 minutes ago -
The movie Moneyball (based on the book by Michael
Lewis) tells the story of Billy Beane,...
asked 6 minutes ago -
A regional highway uses 8 tollbooths that are open to all
vehicles. A chi-square goodness-of-fit test...
asked 10 minutes ago -
In her Semiannual Monetary Policy Report to Congress on July 13,
2017, then Federal Reserve Chair...
asked 9 minutes ago -
Suppose N packets are sent,
and each packet arrives at rate of L/2R to a link....
asked 28 minutes ago -
17. Show the steps involved in reduction of the ketone in fatty
acid synthesis. Which cofactor...
asked 29 minutes ago -
5.61 g of octane, C8H18, reacts with excess oxygen in a bomb
calorimeter. The heat capacity...
asked 33 minutes ago -
The velocity field of a flow is given by V = (2+1) x
y2 i +...
asked 42 minutes ago -
(EPS with
Convertible Bonds) On June 1, 2012, Bluhm Company and
Amanar Company merged to form...
asked 40 minutes ago -
2. Discuss why the study exemplifies one that agrees with The
American Psychological Association’s (APA) Ethical...
asked 44 minutes ago -
Without considering the following capital gains and losses,
Charlene, who is single, has a taxable income...
asked 51 minutes ago