
Homework Answers
Answer #1

We were unable to transcribe this image
We were unable to transcribe this image
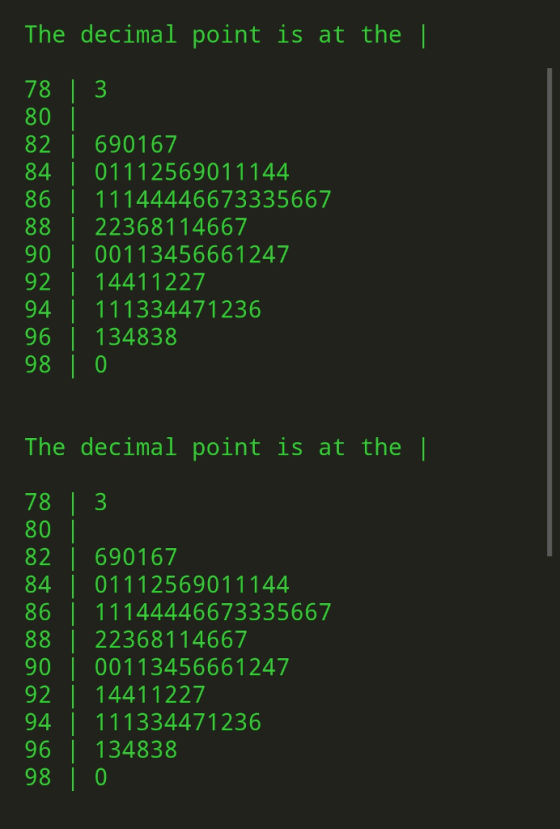
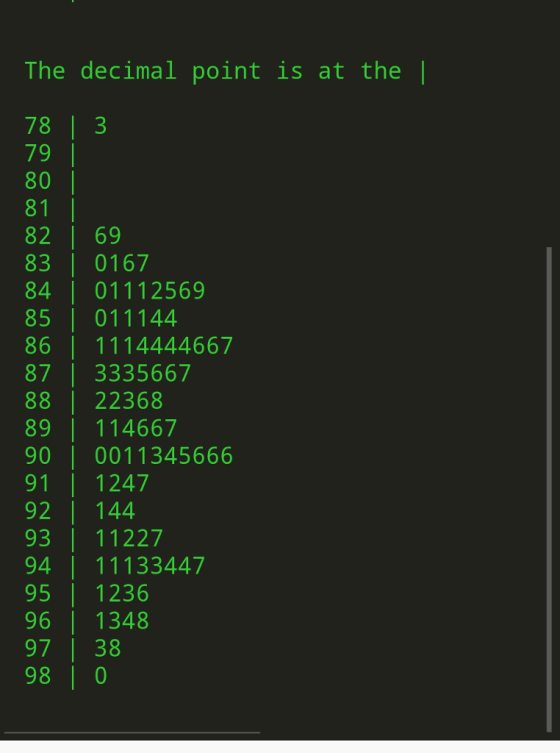
The decimal point is at the 78|3 80 82 690167 84 01112569011144 86 11144446673335667 88 22368114667 90 00113456661247 92 14411227 94 111334471236 96 134838 980 The decimal point is at the| 78 3 80 82 690167 84 01112569011144 86 11144446673335667 88 22368114667 90 00113456661247 92 14411227 94 111334471236 96 134838 98 0
We were unable to transcribe this image
Know the answer?
Add Answer to:
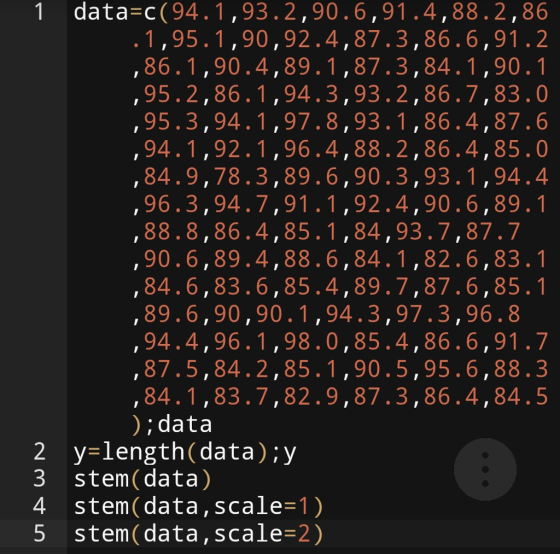
2-17. The data that follow represent the yield on 90 consec- utive batches of ceramic substrate...
Not the answer you're looking for?
Ask your own homework help question.
Our experts will answer your question WITHIN MINUTES for Free.
Similar Homework Help Questions
Steps Open the Heart Rate Dataset in Excel Using the classification of variables from Unit 1 assignment as qualitativ...
Steps Open the Heart Rate Dataset in Excel Using the classification of variables from Unit 1 assignment as qualitative, quantitative discrete, or quantitative continuous, match each of the 3 variables to the most appropriate graph type. (For example, qualitative data can best be displayed with a pie chart or bar graph; continuous numerical data can best be displayed using a histogram) Use the graphing functions in Excel to create an appropriate graph of the data for each variable. Remember to...
ADVERTISEMENT
Need Online Homework Help?
Ask
a QuestionGet Answers For Free
Most questions answered within 3 hours.
Most questions answered within 3 hours.
ADVERTISEMENT
ADVERTISEMENT
Active Questions
-
On January 1, 20X7, Green Corp. paid $1,020,000 to acquire Wax
Co. Wax maintained separate incorporation....
asked 43 minutes ago -
S sells property with a $500 basis to B for $450, and B later
sells the...
asked 42 minutes ago -
C++
Write a class Fraction that defines adding, subtracting,
multiplying, and dividing fractions by overloading standard...
asked 2 hours ago -
This java code won't run and I can't figure out the problem with
it. Please help...
asked 2 hours ago -
Trace the following recursive methods:
a) isPal with the string “abccda”
b) isAnBn with the string...
asked 4 hours ago -
1. Which of the following is false about photosynthesis?
A. ATP is the molecule used to...
asked 4 hours ago -
A simple random sample of size n=64 is obtained from a
population with a mean of...
asked 5 hours ago -
(2 dimensions, 1 object, 2 accelerations)
1) A projectile is thrown with a wind. The wind...
asked 6 hours ago -
Brian makes $34,100 per year. How much can Brian expect to
contribute to FICA taxes in...
asked 7 hours ago -
To buy a new house you must borrow $155,000. To do this you take
out a...
asked 7 hours ago -
Spacely Sprockets is evaluating the construction of a new plant
on land the company purchased for...
asked 8 hours ago -
1. Consider a linear regression model of y on K regressors and
an intercept.
(i) Describe...
asked 8 hours ago
ADVERTISEMENT