
please help with question 3. thanks for your help
Homework Answers
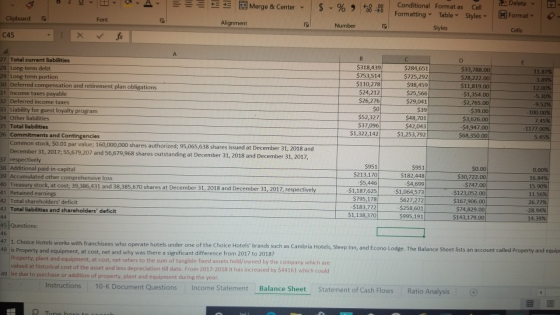
| Shareholder's equity amount would be increased by the amount of treasury stock if there was no purchase of treasury stock | |||||||
| Dec 31,2018 | Dec 31,2017 | ||||||
| Total shareholder's deficit | -183772 | -258601 | |||||
| Add: Treasury stock | 1187625 | 1064573 | |||||
| Total shareholder's equity | 1003853 | 805972 | |||||
Add Answer to:
please help with question 3. thanks for your help
D 12 Months Ended 2 Horizontal Analysis...
Please help with question #5 F A 12 Months Ended Horizontal Analysis Consolidated Balance Sheets- USD...
 Please help with question #5
F A 12 Months Ended Horizontal Analysis Consolidated Balance Sheets- USD ($) $ in Thousands $ Change 2017 to 2018 % Change 2017 to 2018 Dec. 31, 2017 Dec. 31, 2018 Current assets -88.68% -$208,694.00 $235,336 $26,642 Cash and cash equivalents Receivables (net of allowance for doubtful accounts of $15,905 and $12,221, respectively) $12,148.00 $10,122.00 9.65% $125,870 $0 $138,018 $10,122 $36,759 $32,243 0.00% Income taxes receivable 177.30% $23,503.00 $13,256 Notes receivable, net of allowances $6,276.00...
Please help with question #5
F A 12 Months Ended Horizontal Analysis Consolidated Balance Sheets- USD ($) $ in Thousands $ Change 2017 to 2018 % Change 2017 to 2018 Dec. 31, 2017 Dec. 31, 2018 Current assets -88.68% -$208,694.00 $235,336 $26,642 Cash and cash equivalents Receivables (net of allowance for doubtful accounts of $15,905 and $12,221, respectively) $12,148.00 $10,122.00 9.65% $125,870 $0 $138,018 $10,122 $36,759 $32,243 0.00% Income taxes receivable 177.30% $23,503.00 $13,256 Notes receivable, net of allowances $6,276.00...
please answer question #5. the previous answer was incorrect. 5. What is the most significant trend...
 please answer question #5. the previous answer was
incorrect.
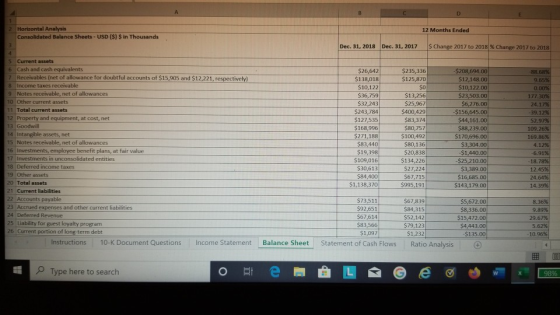
5. What is the most significant trend based on your horizontal analysis over this three-year period? Why? 12 Months Ended Horizontal Analysis Consolidated Balance Sheets - USD ($) $ in Thousands Dec. 31, 2018 Dec. 31, 2017 S Change 2017 to 2018 % Change 2017 to 2018 $208,694.00 -88.68% 1 Current assets Cash and cash equivalents $26,642 $235,336 Receivables (net of allowance for doubtful accounts of $15,905 and $12,221, respectively) $138,018...
please answer question #5. the previous answer was
incorrect.
5. What is the most significant trend based on your horizontal analysis over this three-year period? Why? 12 Months Ended Horizontal Analysis Consolidated Balance Sheets - USD ($) $ in Thousands Dec. 31, 2018 Dec. 31, 2017 S Change 2017 to 2018 % Change 2017 to 2018 $208,694.00 -88.68% 1 Current assets Cash and cash equivalents $26,642 $235,336 Receivables (net of allowance for doubtful accounts of $15,905 and $12,221, respectively) $138,018...
please read footnote 13 and answer Question #4 Total shareholders's deficit 4. What does the "Long-term...
 please read footnote 13 and answer Question #4
Total shareholders's deficit 4. What does the "Long-term debt" item represent? 5. What is the most significant trend based on your horizontal While the total amount of assets increased by 14.39% on a year year basis from 2017 to 2018 we can see that the company's tot current assets declined by 39.12% During the same period total c liabilities increased by 11.87% and this means that the company's current ratio declined. This...
please read footnote 13 and answer Question #4
Total shareholders's deficit 4. What does the "Long-term debt" item represent? 5. What is the most significant trend based on your horizontal While the total amount of assets increased by 14.39% on a year year basis from 2017 to 2018 we can see that the company's tot current assets declined by 39.12% During the same period total c liabilities increased by 11.87% and this means that the company's current ratio declined. This...
Consolidated Balance Sheets - USD ($) $ in Thousands Jun. 30, 2018 Dec. 31, 2017 Current...
Consolidated Balance Sheets - USD ($) $ in Thousands Jun. 30, 2018 Dec. 31, 2017 Current assets Cash and cash equivalents $ 37,148 $ 235,336 Receivables (net of allowance for doubtful accounts of $14,087 and $12,221, respectively) 186,034 125,870 Income taxes receivable 50 0 Notes receivable, net of allowance 29,237 13,256 Other current assets 30,683 25,967 Total current assets 283,152 400,429 Property and equipment, at cost, net 112,567 83,374 Goodwill 173,741 80,757 Intangible assets, net 248,469 100,492 Notes receivable, net...
please help with question 2 on the ratio analysis tab. I am attaching all tabs to...
 please help with question 2 on the ratio analysis tab.
I am attaching all tabs to help. thanks
A B C D E F G H I Instructions 1. Please enter the data from the previous tabs by clicking on the cell and typing and then clicking on the desired cell. For example to enter Net Income for 2018 type and go to the income statement tab and click on cell 127. 2. Complete the calculations. 3. Explain the significance...
please help with question 2 on the ratio analysis tab.
I am attaching all tabs to help. thanks
A B C D E F G H I Instructions 1. Please enter the data from the previous tabs by clicking on the cell and typing and then clicking on the desired cell. For example to enter Net Income for 2018 type and go to the income statement tab and click on cell 127. 2. Complete the calculations. 3. Explain the significance...
please help me find the followings. question #2) a,b, c,d from this balance sheet. please only for year 2018 pl...
 please help me find the followings.
question #2) a,b, c,d from this balance sheet.
please only for year 2018
please also explain how you solved it.
thank you very much.
What is the largest expense and its amount? a. Study the company's 2018 balance sheet and answer the following questions: a. What classes of stock(shares) did the company issued? b. Which item carries a larger balance-the Common Stock account or Paid-In Capital in Excess of Par (also labeled Additional Paid-In...
please help me find the followings.
question #2) a,b, c,d from this balance sheet.
please only for year 2018
please also explain how you solved it.
thank you very much.
What is the largest expense and its amount? a. Study the company's 2018 balance sheet and answer the following questions: a. What classes of stock(shares) did the company issued? b. Which item carries a larger balance-the Common Stock account or Paid-In Capital in Excess of Par (also labeled Additional Paid-In...
12 Months Ended Consolidated Statements of Income - USD ($) shares in Millions, $ in Millions...
 12 Months Ended Consolidated Statements of Income - USD ($) shares in Millions, $ in Millions Jan. 31, 2018 Jan. 31, 2017 99.08% 0 $ 495,761 4,582 500,343 $ 481,317 4,556 485,873 99.06% 0.94% 0 373,396 106,510 0 o 361,256 101,853 20,437 22,764 3 Revenues: 4 Net sales 5 Membership and other income 6 Total revenues 7 Costs and expenses: 8 Cost of sales Operating, selling, general and administrative 9 expenses 10 Operating income 11 Interest: 12 Debt 13 Capital...
Problem 3-2 Balance sheet preparation; missing elements [LO3-2, 3-3] The data listed below are taken from...
Problem 3-2 Balance sheet preparation; missing elements [LO3-2, 3-3] The data listed below are taken from a balance sheet of Trident Corporation at December 31, 2018. Required: 1. Determine the missing amounts. 2. Prepare Trident's classified balance sheet. 1- Determine the missing amounts. (Enter the answers in thousands of dollars.) ($ in 000s) Cash and cash equivalents $241,286 Short-term investments 356,700 Accounts receivable (net of allowance) 507,944 Inventories Prepaid expenses (current) 86,259 Total current assets 1,624,927 Long-term receivables 113,800 Property...
Need help with what I got wrong, please. Following is the balance sheet for Target Corporation....
 Need help with what I got wrong, please.
Following is the balance sheet for Target Corporation. Prepare Target's common-size balance sheets as of February 3, 2018 and January 28, 2017. February 3, January 28, 2018 2017 $2,643 8,657 1,264 12,564 500 25,018 1,417 $2,512 3,309 1,169 11.990 24.658 1 783 $37.431 $38.999 ($ millions) Assets Cash and cash equivalents Inventory Other current assets Total current assets Property and equipment, net Oberon Other noncurrent assets Total assets liabilities Liabilities and shareholders'...
Need help with what I got wrong, please.
Following is the balance sheet for Target Corporation. Prepare Target's common-size balance sheets as of February 3, 2018 and January 28, 2017. February 3, January 28, 2018 2017 $2,643 8,657 1,264 12,564 500 25,018 1,417 $2,512 3,309 1,169 11.990 24.658 1 783 $37.431 $38.999 ($ millions) Assets Cash and cash equivalents Inventory Other current assets Total current assets Property and equipment, net Oberon Other noncurrent assets Total assets liabilities Liabilities and shareholders'...
can i get help please? The Verifine Department Stores, Inc. chief executive officer (CEO) has asked...
 can i get help please?
The Verifine Department Stores, Inc. chief executive officer (CEO) has asked you to compare the company's profit performance and financial position with the average for the industry. The company's income statement and balance sheet as well as the industry average data for retailers. (Click the icon to view the income statement.) (Click the icon to view the balance sheet.) Read the requirements Verifine Department Stores, Inc. Income Statement Year Ended December 31, 2018 Amount Percent...
can i get help please?
The Verifine Department Stores, Inc. chief executive officer (CEO) has asked you to compare the company's profit performance and financial position with the average for the industry. The company's income statement and balance sheet as well as the industry average data for retailers. (Click the icon to view the income statement.) (Click the icon to view the balance sheet.) Read the requirements Verifine Department Stores, Inc. Income Statement Year Ended December 31, 2018 Amount Percent...
 Please help with question #5
F A 12 Months Ended Horizontal Analysis Consolidated Balance Sheets- USD ($) $ in Thousands $ Change 2017 to 2018 % Change 2017 to 2018 Dec. 31, 2017 Dec. 31, 2018 Current assets -88.68% -$208,694.00 $235,336 $26,642 Cash and cash equivalents Receivables (net of allowance for doubtful accounts of $15,905 and $12,221, respectively) $12,148.00 $10,122.00 9.65% $125,870 $0 $138,018 $10,122 $36,759 $32,243 0.00% Income taxes receivable 177.30% $23,503.00 $13,256 Notes receivable, net of allowances $6,276.00...
Please help with question #5
F A 12 Months Ended Horizontal Analysis Consolidated Balance Sheets- USD ($) $ in Thousands $ Change 2017 to 2018 % Change 2017 to 2018 Dec. 31, 2017 Dec. 31, 2018 Current assets -88.68% -$208,694.00 $235,336 $26,642 Cash and cash equivalents Receivables (net of allowance for doubtful accounts of $15,905 and $12,221, respectively) $12,148.00 $10,122.00 9.65% $125,870 $0 $138,018 $10,122 $36,759 $32,243 0.00% Income taxes receivable 177.30% $23,503.00 $13,256 Notes receivable, net of allowances $6,276.00...
 please answer question #5. the previous answer was
incorrect.
5. What is the most significant trend based on your horizontal analysis over this three-year period? Why? 12 Months Ended Horizontal Analysis Consolidated Balance Sheets - USD ($) $ in Thousands Dec. 31, 2018 Dec. 31, 2017 S Change 2017 to 2018 % Change 2017 to 2018 $208,694.00 -88.68% 1 Current assets Cash and cash equivalents $26,642 $235,336 Receivables (net of allowance for doubtful accounts of $15,905 and $12,221, respectively) $138,018...
please answer question #5. the previous answer was
incorrect.
5. What is the most significant trend based on your horizontal analysis over this three-year period? Why? 12 Months Ended Horizontal Analysis Consolidated Balance Sheets - USD ($) $ in Thousands Dec. 31, 2018 Dec. 31, 2017 S Change 2017 to 2018 % Change 2017 to 2018 $208,694.00 -88.68% 1 Current assets Cash and cash equivalents $26,642 $235,336 Receivables (net of allowance for doubtful accounts of $15,905 and $12,221, respectively) $138,018...
 please read footnote 13 and answer Question #4
Total shareholders's deficit 4. What does the "Long-term debt" item represent? 5. What is the most significant trend based on your horizontal While the total amount of assets increased by 14.39% on a year year basis from 2017 to 2018 we can see that the company's tot current assets declined by 39.12% During the same period total c liabilities increased by 11.87% and this means that the company's current ratio declined. This...
please read footnote 13 and answer Question #4
Total shareholders's deficit 4. What does the "Long-term debt" item represent? 5. What is the most significant trend based on your horizontal While the total amount of assets increased by 14.39% on a year year basis from 2017 to 2018 we can see that the company's tot current assets declined by 39.12% During the same period total c liabilities increased by 11.87% and this means that the company's current ratio declined. This...
 please help with question 2 on the ratio analysis tab.
I am attaching all tabs to help. thanks
A B C D E F G H I Instructions 1. Please enter the data from the previous tabs by clicking on the cell and typing and then clicking on the desired cell. For example to enter Net Income for 2018 type and go to the income statement tab and click on cell 127. 2. Complete the calculations. 3. Explain the significance...
please help with question 2 on the ratio analysis tab.
I am attaching all tabs to help. thanks
A B C D E F G H I Instructions 1. Please enter the data from the previous tabs by clicking on the cell and typing and then clicking on the desired cell. For example to enter Net Income for 2018 type and go to the income statement tab and click on cell 127. 2. Complete the calculations. 3. Explain the significance...
 please help me find the followings.
question #2) a,b, c,d from this balance sheet.
please only for year 2018
please also explain how you solved it.
thank you very much.
What is the largest expense and its amount? a. Study the company's 2018 balance sheet and answer the following questions: a. What classes of stock(shares) did the company issued? b. Which item carries a larger balance-the Common Stock account or Paid-In Capital in Excess of Par (also labeled Additional Paid-In...
please help me find the followings.
question #2) a,b, c,d from this balance sheet.
please only for year 2018
please also explain how you solved it.
thank you very much.
What is the largest expense and its amount? a. Study the company's 2018 balance sheet and answer the following questions: a. What classes of stock(shares) did the company issued? b. Which item carries a larger balance-the Common Stock account or Paid-In Capital in Excess of Par (also labeled Additional Paid-In...
 12 Months Ended Consolidated Statements of Income - USD ($) shares in Millions, $ in Millions Jan. 31, 2018 Jan. 31, 2017 99.08% 0 $ 495,761 4,582 500,343 $ 481,317 4,556 485,873 99.06% 0.94% 0 373,396 106,510 0 o 361,256 101,853 20,437 22,764 3 Revenues: 4 Net sales 5 Membership and other income 6 Total revenues 7 Costs and expenses: 8 Cost of sales Operating, selling, general and administrative 9 expenses 10 Operating income 11 Interest: 12 Debt 13 Capital...
 Need help with what I got wrong, please.
Following is the balance sheet for Target Corporation. Prepare Target's common-size balance sheets as of February 3, 2018 and January 28, 2017. February 3, January 28, 2018 2017 $2,643 8,657 1,264 12,564 500 25,018 1,417 $2,512 3,309 1,169 11.990 24.658 1 783 $37.431 $38.999 ($ millions) Assets Cash and cash equivalents Inventory Other current assets Total current assets Property and equipment, net Oberon Other noncurrent assets Total assets liabilities Liabilities and shareholders'...
Need help with what I got wrong, please.
Following is the balance sheet for Target Corporation. Prepare Target's common-size balance sheets as of February 3, 2018 and January 28, 2017. February 3, January 28, 2018 2017 $2,643 8,657 1,264 12,564 500 25,018 1,417 $2,512 3,309 1,169 11.990 24.658 1 783 $37.431 $38.999 ($ millions) Assets Cash and cash equivalents Inventory Other current assets Total current assets Property and equipment, net Oberon Other noncurrent assets Total assets liabilities Liabilities and shareholders'...
 can i get help please?
The Verifine Department Stores, Inc. chief executive officer (CEO) has asked you to compare the company's profit performance and financial position with the average for the industry. The company's income statement and balance sheet as well as the industry average data for retailers. (Click the icon to view the income statement.) (Click the icon to view the balance sheet.) Read the requirements Verifine Department Stores, Inc. Income Statement Year Ended December 31, 2018 Amount Percent...
can i get help please?
The Verifine Department Stores, Inc. chief executive officer (CEO) has asked you to compare the company's profit performance and financial position with the average for the industry. The company's income statement and balance sheet as well as the industry average data for retailers. (Click the icon to view the income statement.) (Click the icon to view the balance sheet.) Read the requirements Verifine Department Stores, Inc. Income Statement Year Ended December 31, 2018 Amount Percent...
Most questions answered within 3 hours.
-
For the following reaction, 0.128 moles of
potassium hydrogen sulfateare mixed with
0.504 moles of potassium...
asked 2 hours ago -
1. What is the present value of $400, three years in the future
if the interest...
asked 3 hours ago -
The labor force minus the number of employed equals the number
of unemployed.
a. True
b....
asked 5 hours ago -
Determine the mass in units of grams [g] of 0.49 moles [mol]
of a new fictitious...
asked 5 hours ago -
A horizontal mass of M=5kg is on a spring and stretched to
x=0.5m when released from...
asked 6 hours ago -
26 of 50
"I have worked at the Arizona Humane Society for ten years, and
have...
asked 7 hours ago -
Compare and contrast zero based budgeting and incremental (or
base year) budgeting.
asked 7 hours ago -
4 pts 10. Which of the following hypothesis would be MOST
difficult to test experimentally? Group...
asked 7 hours ago -
A business owner makes 1,000 items a day. Each day he or she
contributes eight hours...
asked 7 hours ago -
A
circular loop in the plane of a paper lies inca0.65 T magnetic
field pointing into...
asked 7 hours ago -
A business owner is trying to decide whether to buy, rent, or
lease office space and...
asked 7 hours ago -
Thermal Storage Solar heating of a house is much more efficient
if there is a way...
asked 7 hours ago