


please show how numbers are calculated. and all work must be done in excel
Homework Answers
Dear Student , please see below answer completely based on multiple level if ratio analysis with Market Trend . All Ratio has been supported with Formula and number as per Question .
| Industry Standard | |||
| Year | Year | Year | |
| 2017 | 2016 | 2017 | |
| Liquidity ratio | |||
| Current ratio | |||
| Current Asset/ Current Liability | |||
| Current Asset $-a | 12,23,000 | 10,04,000 | |
| Current Liability $-b | 6,20,000 | 4,83,000 | |
| Current ratio(a/b) | 1.97 | 2.08 | 2.5X |
| Quick ratio | |||
| Current Asset- Inventory / Current Liability | |||
| Current Asset $-a | 12,23,000 | 10,04,000 | |
| Less- Inventory | 2,89,000 | 3,00,000 | |
| Current Asset- Inventory $-a | 9,34,000 | 7,04,000 | |
| Current Liability $-b | 6,20,000 | 4,83,000 | |
| Quick ratio (a/b) | 1.51 | 1.46 | 0.60X |
| Efficiency ratio | |||
| Inventory turnover ratio | |||
| Cost of Good sold / Inventory | |||
| Cost of Good sold $-a | 20,88,000 | 17,11,000 | |
| Inventory-b | 2,89,000 | 3,00,000 | |
| Inventory turnover ratio(a/b) | 7.22 | 5.70 | 6.50X |
| Account receivable Turnover ratio | |||
| Credit sales / Account receivable | |||
| Sales $=a | 30,74,000 | 25,67,000 | |
| Account receivable $=b | 5,03,000 | 3,65,000 | |
| Account receivable Turnover ratio(a/b) | 6.11 | 7.03 | 8X |
| Average Collection period | |||
| 365/ Account receivable turnover ratio | |||
| Average Collection period in Days | 59.73 | 51.90 | 40 days |
| Year 2017=(365 days/6.11) and Year 2016(365 days /7.03) | |||
| Fixed asset Turnover ratio | |||
| Turnover(Sales)/ Fixed Asset(Net) | |||
| Sales $=a | 30,74,000 | 25,67,000 | |
| Fixed asset ( Net)$ b | 23,74,000 | 22,66,000 | |
| Fixed asset Turnover ratio(a/b) | 1.29 | 1.13 | 2.00X |
| Total asset Turnover ratio | |||
| Sales $=a | 30,74,000 | 25,67,000 | |
| Total Asset$ b | 35,97,000 | 32,70,000 | |
| Total asset Turnover ratio(a/b) | 0.85 | 0.79 | 2.00X |
| leverage Ratio | |||
| Total Debt ratio | |||
| Total Debt /Total Asset | |||
| Total Debt $-a | 16,43,000 | 14,50,000 | |
| Total Asset $-b | 35,97,000 | 32,70,000 | |
| Total Debt /Total Asset(a/b) | 45.68% | 44.34% | 50% |
| Long term Debt ratio | |||
| Total Long term debt /Total Asset | |||
| Long term debt $ -a | 10,23,000 | 9,67,000 | |
| Total Asset $-b | 35,97,000 | 32,70,000 | |
| Total Long term debt /Total Asset(a/b) | 28.44% | 29.57% | 20% |
| Total Long term debt /Capitalization | |||
| Long term debt $ -a | 10,23,000 | 9,67,000 | |
| Total Capitalization | |||
| Equity Shareholders | 19,54,000 | 18,20,000 | |
| Long term Debt+ Total Equity$ b | 29,77,000 | 27,87,000 | |
| Total Long term debt /Capitalization ( a/b) | 34.36% | 34.70% | 30% |
| Debt to Equity | |||
| Total Debt $ -a | 16,43,000 | 14,50,000 | |
| Equity Shareholders$-b | 19,54,000 | 18,20,000 | |
| Debt to Equity(a/b) | 0.84 | 0.80 | 0.90X |
| Long term debt/ Equity | |||
| Long term debt $ -a | 10,23,000 | 9,67,000 | |
| Equity$ b | 19,54,000 | 18,20,000 | |
| Long term debt/ Equity(a/b) | 52.35% | 53.13% | 40% |
| Profitability ratio | |||
| Gross profit margin | |||
| Gross profit / Sales | |||
| Gross profit $ a | 9,86,000 | 8,56,000 | |
| Sales $=b | 30,74,000 | 25,67,000 | |
| Gross profit / Sales (a/b) | 32.08% | 33.35% | 20% |
| Operating profit margin | |||
| Operting profit $ a ( EBIT) | 4,18,000 | 3,03,000 | |
| Sales $=b | 30,74,000 | 25,67,000 | |
| Operating profit margin(a/b) | 13.60% | 11.80% | 5% |
| Net Profit Margin | |||
| Net Profit$ a | 2,31,000 | 1,48,000 | |
| Sales $=b | 30,74,000 | 25,67,000 | |
| Net Profit Margin(a/b) | 7.51% | 5.77% | 5% |
| Return on Total Asset | |||
| return $ a | 2,31,000 | 1,48,000 | |
| Total Asset $ b | 35,97,000 | 32,70,000 | |
| Return on Total Asset (a/b) | 6.42% | 4.53% | 5% |
| Return on Equity | |||
| return $ a | 2,31,000 | 1,48,000 | |
| Equity $ b | 19,54,000 | 18,20,000 | |
| Return on Equity ( a/b) | 11.82% | 8.13% | 8% |
| 2017$ | 2016$ | |
| Economic Profit | ||
| Tax rate | 28.92% | 30.19% |
| NOPAT | ||
|
( Net Operating Profit after tax) Accounting Profit $ |
2,31,000 | 1,48,000 |
| Weighted Average cost of capital -a | 12% | 12% |
| Tax rate b | 28.92% | 30.19% |
| Tax on Cost of capital(a*b) | 3.47% | 3.62% |
| After Tax on Cost of capital=c | 8.53% | 8.38% |
| Total Operating capital( NOWC) | ||
| Current Asset $-a | 12,23,000 | 10,04,000 |
| Current Liability $-b | 6,20,000 | 4,83,000 |
| Total Operating capital( NOWC)(a-b) $=d | 6,03,000 | 5,21,000 |
| Dollar value of Cost of capital(c*d) | 51,433 | 43,645 |
| Economic Profit | ||
|
( Net Operating Profit after tax) Accounting Profit $ |
2,31,000 | 1,48,000 |
| Less - | ||
| Dollar value of Cost of capital$ | 51,433 | 43,645 |
| Economic Profit $ | 1,79,567 | 1,04,355 |
Add Answer to:
please show how numbers are calculated. and all work
must be done in excel
CHAPTER 3:...
please show all work in Excel CHAPTER 3: FINANCIAL STATEMENT ANALYSIS TOOLS NOTE: PLEASE USE WORKSHEET...
 please show all work in Excel
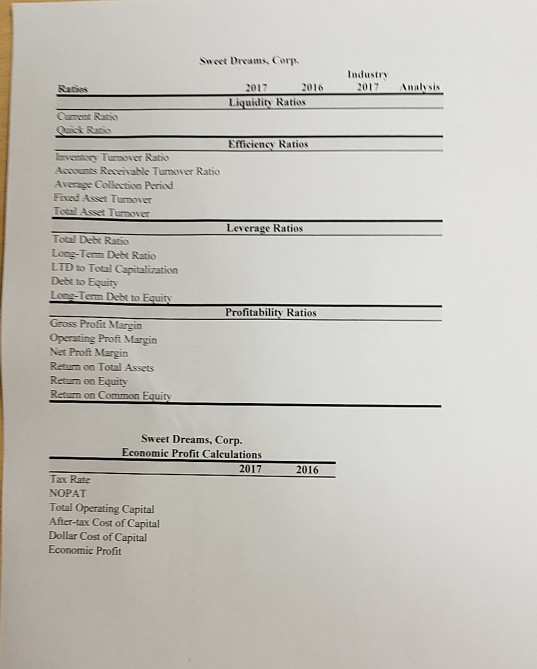
CHAPTER 3: FINANCIAL STATEMENT ANALYSIS TOOLS NOTE: PLEASE USE WORKSHEET #3 IN THE ATTACHED EXCEL FILE TITLED "Homework for Chapter 3_Excel TO SOLVE THE FOLLOWING PROBLEM. Homework for Chapter 3: Problem #1 in the text (Chapter 3) Sweet Dreams Corp. Balance Sheet As of Dec. 31 2017 Assets 2017 2016 Cash 431.000 339,000 Accounts Receivable 503.000 365,000 Inventories 289,000 300,000 Total Current Assets 1.223.000 1.004.000 Sweet Dreams Corp. Income Statement For the Year Ended...
please show all work in Excel
CHAPTER 3: FINANCIAL STATEMENT ANALYSIS TOOLS NOTE: PLEASE USE WORKSHEET #3 IN THE ATTACHED EXCEL FILE TITLED "Homework for Chapter 3_Excel TO SOLVE THE FOLLOWING PROBLEM. Homework for Chapter 3: Problem #1 in the text (Chapter 3) Sweet Dreams Corp. Balance Sheet As of Dec. 31 2017 Assets 2017 2016 Cash 431.000 339,000 Accounts Receivable 503.000 365,000 Inventories 289,000 300,000 Total Current Assets 1.223.000 1.004.000 Sweet Dreams Corp. Income Statement For the Year Ended...
Please show all work. 1. Statement of Cash Flows and Standardized Financial Statements a) Net income...
 Please show all work. 1. Statement of Cash Flows and Standardized Financial Statements a) Net income for your firm was $10,000 last year. The depreciation expense was $2,500; accounts receivable increased $1,250; accounts payable increased $800; and inventories increased by $2,000. Identify the sources and uses of cash • What was the total cash flow from operations for the period? Operating activities = Net Income + Depreciation + Source (inflow) - Use foutflow) b) i) Prepare the 2018 common-size Income...
Some recent financial statements for Smolira Golf Corp. follow SMOLIRA GOLF CORP 2017 and 2018 Balance...
 Some recent financial statements for Smolira Golf Corp. follow SMOLIRA GOLF CORP 2017 and 2018 Balance Sheets Assets Liabilities and Owners' Equity 2017 2018 2017 2018 Current assets Current liabilities $ 24,116 24,800 15,900 27,800 63,656 68,500 $23,884 27,800 11,500 15,700 $53,155 55,000 $76,000 80,259 Cash Accounts 13,148 26,392 Accounts payable Notes payable Other 17,000 receivable Inventory 12,271 Total Total Long-term debt Owners' equity Common stock and paid-in $40,000 40,00o surplus Accumulated retained 226,196 258,741 earnings Fixed assets Net plant...
The balance sheet and income statement for the A. Thiel Mfg. Company are as follows. Calculate...
 The balance sheet and income statement for the A. Thiel Mfg.
Company are as follows. Calculate the ratios at the
bottom.
Cash $ 500 Accounts receivable 2,000 Inventories 1,000 Current assets $3,500 Net fixed assets 4,500 Total assets $8,000 Accounts payable $1,100 Accrued expenses 600 Short-term notes payable 300 Current liabilities $2,000 Long-term debt 2,000 Owners' equity 4,000 Total liabilities and owners' equity $8,000 Income Statement ($000) Sales (all credit) $8,000 Cost of goods sold (3,300) Gross profit $4,700 Operating...
The balance sheet and income statement for the A. Thiel Mfg.
Company are as follows. Calculate the ratios at the
bottom.
Cash $ 500 Accounts receivable 2,000 Inventories 1,000 Current assets $3,500 Net fixed assets 4,500 Total assets $8,000 Accounts payable $1,100 Accrued expenses 600 Short-term notes payable 300 Current liabilities $2,000 Long-term debt 2,000 Owners' equity 4,000 Total liabilities and owners' equity $8,000 Income Statement ($000) Sales (all credit) $8,000 Cost of goods sold (3,300) Gross profit $4,700 Operating...
can you answer part (a)? Only 1- Average collection period. 2- Total assest turnover. 3- Total Debt Ratio. CHAPTER 3: WORKING WITH FINANCIAL STATEMENTS Assignment 1: 1. Michigan Corp. has prepared...
 can you answer part (a)? Only 1- Average collection period. 2-
Total assest turnover. 3- Total Debt Ratio.
CHAPTER 3: WORKING WITH FINANCIAL STATEMENTS Assignment 1: 1. Michigan Corp. has prepared the following financial statements: Michigan Corp. Balance Sheet Michigan Corp. lacome Statement Year Endrd Dec. 31 2017 ,074,000 2,557,000 Cash 2088.000 1.711000 Ascounts Receivable Sales Cost of Goods Seld 03,000 365,000 289.000 300,000 223,000 1.004,000 4,669,000 4,322000 986,000 856,000Invenories Gress Prefit Selling and G&A Expenses 294,000 Fixed Expenses Depreciation...
can you answer part (a)? Only 1- Average collection period. 2-
Total assest turnover. 3- Total Debt Ratio.
CHAPTER 3: WORKING WITH FINANCIAL STATEMENTS Assignment 1: 1. Michigan Corp. has prepared the following financial statements: Michigan Corp. Balance Sheet Michigan Corp. lacome Statement Year Endrd Dec. 31 2017 ,074,000 2,557,000 Cash 2088.000 1.711000 Ascounts Receivable Sales Cost of Goods Seld 03,000 365,000 289.000 300,000 223,000 1.004,000 4,669,000 4,322000 986,000 856,000Invenories Gress Prefit Selling and G&A Expenses 294,000 Fixed Expenses Depreciation...
Profitability ratios: l. Profit margin % m. Return on assets % n. Return on equity %...
Profitability ratios: l. Profit margin % m. Return on assets % n. Return on equity % SMOLIRA GOLF CORP. 2018 Income Statement Sales $ 336,329 Cost of goods sold 231,000 Depreciation 21,600 Earnings before interest and taxes $ 83,729 Interest paid 14,400 Taxable income $ 69,329 Taxes (21%) 14,559 Net income $ 54,770 Dividends $ 21,000 Retained earnings 33,770 Some recent financial statements for Smolira Golf Corp. follow. SMOLIRA GOLF CORP. 2017 and 2018 Balance Sheets Assets Liabilities and...
Some recent financial statements for Smolira Golf Corp. follow SMOLIRA GOLF CORP 2017 and 2018 Balance...
 Some recent financial statements for Smolira Golf Corp. follow SMOLIRA GOLF CORP 2017 and 2018 Balance Sheets Assets Liabilities and Owners' Equity 2017 2018 2017 2018 Current assets Current liabilities Cash $ 24,056 24,200 15,300 27,200 $ 62,196 $66,700 $ 23,284 $ 27,200 10,900 15,900 $ 46,955 54,000 90,000 93,294 Accounts Inventory Total Accounts payable Notes payable Other 12,548 12,000 receivable 25,592 11,671 Total Long-term debt Owners' equity Common stock and paid-in $42,000 42,000 surplus Accumulated retained 208,936 242,706 earnings...
Some recent financial statements for Earl Grey Golf Corp. follow. Assets 2018 Current assets Cash Accounts...
 Some recent financial statements for Earl Grey Golf Corp. follow. Assets 2018 Current assets Cash Accounts receivable Inventory Total EARL GREY GOLF CORP. 2017 and 2018 Statement of Financial Position Liabilities and Owners' Equity 2017 2018 2017 Current liabilities $ 24,046 $ 24,255 Accounts payable $ 23,184 12,448 15, 235 Notes payable 12,000 25,392 27,155 Other 11,571 $ 61,886 $ 66,645 Total $ 46,755 Long-term debt $ 80,000 Owners' equity $324,695 $365,734 Common stock and paid-in surplus $ 40,000 Retained...
2. Calculating Financial Ratios [LO2] Find the following financial ratios for Smolira Golf Corp. for 2018...
 2. Calculating Financial Ratios [LO2] Find the following financial ratios for Smolira Golf Corp. for 2018 (year-end figures reflect average values where appropriate): Assets Current assets Cash Accounts receivable Inventory Total SMOLIRA GOLF CORP. 2018 Balance Sheets Liabilities and Owners' Equity 2018 2018 Current liabilities $ 37,837 Accounts payable $ 42,582 27,766 Notes payable 16,200 42.632 Other 24 634 108,235 Total 83,416 145,000 Long-term debt Owners' equity Common stock and paid-in surplus Retained earnings Total Equity Total liabilities and owners'...
 please show all work in Excel
CHAPTER 3: FINANCIAL STATEMENT ANALYSIS TOOLS NOTE: PLEASE USE WORKSHEET #3 IN THE ATTACHED EXCEL FILE TITLED "Homework for Chapter 3_Excel TO SOLVE THE FOLLOWING PROBLEM. Homework for Chapter 3: Problem #1 in the text (Chapter 3) Sweet Dreams Corp. Balance Sheet As of Dec. 31 2017 Assets 2017 2016 Cash 431.000 339,000 Accounts Receivable 503.000 365,000 Inventories 289,000 300,000 Total Current Assets 1.223.000 1.004.000 Sweet Dreams Corp. Income Statement For the Year Ended...
please show all work in Excel
CHAPTER 3: FINANCIAL STATEMENT ANALYSIS TOOLS NOTE: PLEASE USE WORKSHEET #3 IN THE ATTACHED EXCEL FILE TITLED "Homework for Chapter 3_Excel TO SOLVE THE FOLLOWING PROBLEM. Homework for Chapter 3: Problem #1 in the text (Chapter 3) Sweet Dreams Corp. Balance Sheet As of Dec. 31 2017 Assets 2017 2016 Cash 431.000 339,000 Accounts Receivable 503.000 365,000 Inventories 289,000 300,000 Total Current Assets 1.223.000 1.004.000 Sweet Dreams Corp. Income Statement For the Year Ended...
 Please show all work. 1. Statement of Cash Flows and Standardized Financial Statements a) Net income for your firm was $10,000 last year. The depreciation expense was $2,500; accounts receivable increased $1,250; accounts payable increased $800; and inventories increased by $2,000. Identify the sources and uses of cash • What was the total cash flow from operations for the period? Operating activities = Net Income + Depreciation + Source (inflow) - Use foutflow) b) i) Prepare the 2018 common-size Income...
 Some recent financial statements for Smolira Golf Corp. follow SMOLIRA GOLF CORP 2017 and 2018 Balance Sheets Assets Liabilities and Owners' Equity 2017 2018 2017 2018 Current assets Current liabilities $ 24,116 24,800 15,900 27,800 63,656 68,500 $23,884 27,800 11,500 15,700 $53,155 55,000 $76,000 80,259 Cash Accounts 13,148 26,392 Accounts payable Notes payable Other 17,000 receivable Inventory 12,271 Total Total Long-term debt Owners' equity Common stock and paid-in $40,000 40,00o surplus Accumulated retained 226,196 258,741 earnings Fixed assets Net plant...
 The balance sheet and income statement for the A. Thiel Mfg.
Company are as follows. Calculate the ratios at the
bottom.
Cash $ 500 Accounts receivable 2,000 Inventories 1,000 Current assets $3,500 Net fixed assets 4,500 Total assets $8,000 Accounts payable $1,100 Accrued expenses 600 Short-term notes payable 300 Current liabilities $2,000 Long-term debt 2,000 Owners' equity 4,000 Total liabilities and owners' equity $8,000 Income Statement ($000) Sales (all credit) $8,000 Cost of goods sold (3,300) Gross profit $4,700 Operating...
The balance sheet and income statement for the A. Thiel Mfg.
Company are as follows. Calculate the ratios at the
bottom.
Cash $ 500 Accounts receivable 2,000 Inventories 1,000 Current assets $3,500 Net fixed assets 4,500 Total assets $8,000 Accounts payable $1,100 Accrued expenses 600 Short-term notes payable 300 Current liabilities $2,000 Long-term debt 2,000 Owners' equity 4,000 Total liabilities and owners' equity $8,000 Income Statement ($000) Sales (all credit) $8,000 Cost of goods sold (3,300) Gross profit $4,700 Operating...
 can you answer part (a)? Only 1- Average collection period. 2-
Total assest turnover. 3- Total Debt Ratio.
CHAPTER 3: WORKING WITH FINANCIAL STATEMENTS Assignment 1: 1. Michigan Corp. has prepared the following financial statements: Michigan Corp. Balance Sheet Michigan Corp. lacome Statement Year Endrd Dec. 31 2017 ,074,000 2,557,000 Cash 2088.000 1.711000 Ascounts Receivable Sales Cost of Goods Seld 03,000 365,000 289.000 300,000 223,000 1.004,000 4,669,000 4,322000 986,000 856,000Invenories Gress Prefit Selling and G&A Expenses 294,000 Fixed Expenses Depreciation...
can you answer part (a)? Only 1- Average collection period. 2-
Total assest turnover. 3- Total Debt Ratio.
CHAPTER 3: WORKING WITH FINANCIAL STATEMENTS Assignment 1: 1. Michigan Corp. has prepared the following financial statements: Michigan Corp. Balance Sheet Michigan Corp. lacome Statement Year Endrd Dec. 31 2017 ,074,000 2,557,000 Cash 2088.000 1.711000 Ascounts Receivable Sales Cost of Goods Seld 03,000 365,000 289.000 300,000 223,000 1.004,000 4,669,000 4,322000 986,000 856,000Invenories Gress Prefit Selling and G&A Expenses 294,000 Fixed Expenses Depreciation...
 Some recent financial statements for Smolira Golf Corp. follow SMOLIRA GOLF CORP 2017 and 2018 Balance Sheets Assets Liabilities and Owners' Equity 2017 2018 2017 2018 Current assets Current liabilities Cash $ 24,056 24,200 15,300 27,200 $ 62,196 $66,700 $ 23,284 $ 27,200 10,900 15,900 $ 46,955 54,000 90,000 93,294 Accounts Inventory Total Accounts payable Notes payable Other 12,548 12,000 receivable 25,592 11,671 Total Long-term debt Owners' equity Common stock and paid-in $42,000 42,000 surplus Accumulated retained 208,936 242,706 earnings...
 Some recent financial statements for Smolira Golf Corp. follow SMOLIRA GOLF CORP 2017 and 2018 Balance Sheets Assets Liabilities and Owners' Equity 2017 2018 2017 2018 Current assets Current liabilities Cash $ 24,056 24,200 15,300 27,200 $ 62,196 $66,700 $ 23,284 $ 27,200 10,900 15,900 $ 46,955 54,000 90,000 93,294 Accounts Inventory Total Accounts payable Notes payable Other 12,548 12,000 receivable 25,592 11,671 Total Long-term debt Owners' equity Common stock and paid-in $42,000 42,000 surplus Accumulated retained 208,936 242,706 earnings...
 Some recent financial statements for Earl Grey Golf Corp. follow. Assets 2018 Current assets Cash Accounts receivable Inventory Total EARL GREY GOLF CORP. 2017 and 2018 Statement of Financial Position Liabilities and Owners' Equity 2017 2018 2017 Current liabilities $ 24,046 $ 24,255 Accounts payable $ 23,184 12,448 15, 235 Notes payable 12,000 25,392 27,155 Other 11,571 $ 61,886 $ 66,645 Total $ 46,755 Long-term debt $ 80,000 Owners' equity $324,695 $365,734 Common stock and paid-in surplus $ 40,000 Retained...
 2. Calculating Financial Ratios [LO2] Find the following financial ratios for Smolira Golf Corp. for 2018 (year-end figures reflect average values where appropriate): Assets Current assets Cash Accounts receivable Inventory Total SMOLIRA GOLF CORP. 2018 Balance Sheets Liabilities and Owners' Equity 2018 2018 Current liabilities $ 37,837 Accounts payable $ 42,582 27,766 Notes payable 16,200 42.632 Other 24 634 108,235 Total 83,416 145,000 Long-term debt Owners' equity Common stock and paid-in surplus Retained earnings Total Equity Total liabilities and owners'...
Most questions answered within 3 hours.
-
On April 1, 2018, Windel Corporation issued bonds with
detachable warrants.
Information related to these bonds...
asked 15 minutes ago -
public enum Rating {
GENERAL(0),
PARENTALGUIDANCE(1),
MATURE(2);
asked 20 minutes ago -
A certain shop repairs both audio and video components. Let
A denote the event that the...
asked 24 minutes ago -
Modern Human Relations at the workplace- Human resource
management
Communities of practice (COPs) refers to groups...
asked 34 minutes ago -
Briefly compare and contrast Array Processors and
Multiprocessors. Mention at least two similarities and three
dissimilarities.
asked 34 minutes ago -
When looking at the unemployment rates for various countries,
which of the following is a reason...
asked 35 minutes ago -
calculate the ratio of the two iconic forms that exist in solution
for the amino acid...
asked 46 minutes ago -
1. A black hole with a larger mass will have a __________
thermal luminosity.
2. From...
asked 51 minutes ago -
Which is a criterion-referenced standard?
Someone who is accepted into graduate school.
Someone who is of...
asked 1 hour ago -
A beaker with 1.90×10² mL of an acetic acid buffer
with a pH of 5.000 is...
asked 1 hour ago -
define the concept of emotional labor. describe,
explain and discuss perspectives on emotional labor in general...
asked 1 hour ago -
The unsigned decimal value (1,036)(base 10) is to be stored as a
16-bit word in memory....
asked 1 hour ago