
Homework Answers
Add Answer to:
Exhibit 3A-1 Comparison of Market Efficiency and Deadweight Loss LA 4.000 3.50 3.00 50 Price per...
Exhibit 3A-1 Comparison of Market Efficiency and Deadweight Loss 4.00/A 3.50 3.00 2.50 ܙ Price per...
 Exhibit 3A-1 Comparison of Market Efficiency and Deadweight Loss 4.00/A 3.50 3.00 2.50 ܙ Price per pound (dollars) 2:00 ܝ 1.00 ܘ 0.50 2 3 4 5 6 Quantity of Ground Beef (millions of pounds per year) As shown in Exhibit 3A-1, if the market is in equilibrium, then total surplus is represented by: a. ABEC + CEFD b. ABEFD - BEF c. CDFE - EFG O d. ABEFD + EFG
3. (20%) Consider the market was unregulated, with an equilibrium price of $200, and a quantity of 20,000 The suppl...
 3. (20%) Consider the market was unregulated, with an equilibrium price of $200, and a quantity of 20,000 The supply curve is perfectly inelastic, while the demand curve is perfectly elastic. (a) What burden of taxation falls on producers (this is an amount from $0 to $16)?3 (b) What is the Deadweight Loss from the tax? a tax on producers of $16 per unit. Before the tax's imposition,
3. (20%) Consider the market was unregulated, with an equilibrium price of...
3. (20%) Consider the market was unregulated, with an equilibrium price of $200, and a quantity of 20,000 The supply curve is perfectly inelastic, while the demand curve is perfectly elastic. (a) What burden of taxation falls on producers (this is an amount from $0 to $16)?3 (b) What is the Deadweight Loss from the tax? a tax on producers of $16 per unit. Before the tax's imposition,
3. (20%) Consider the market was unregulated, with an equilibrium price of...
QUESTION 6 The deadweight loss associated with a per-unit tax will be small relative to the...
 QUESTION 6 The deadweight loss associated with a per-unit tax will be small relative to the tax revenue collected if: supply and demand are both elastic. O A. supply and demand are both inelastic. OB. supply is elastic, demand is inelastic. OC demand is elastic, supply is inelastic. OD. QUESTION 7 Consider the following statements when answering this question 1. It is not possible to help consumers by simply shifting taxes from consumers paying them to producers paying them. II....
Please rank the follow curves as to how they would contribute to deadweight loss if a...
Please rank the follow curves as to how they would contribute to deadweight loss if a good that had this elasticity was taxed. Assume the supply curve has an elasticity equal to 1. Most deadweigh loss least deadweigh loss 1.a demand curve with price elastisity of demand equal to 100 2. a demand curve with price elastisity of demand equal to 0.4 3. a demand curve that is perfectly inelastic 4. a demand curve that is unit elastic
Homework (Ch 08) 3. Relationship between tax revenues, deadweight loss, and demandelasticity The government is considering...
 Homework (Ch 08) 3. Relationship between tax revenues, deadweight loss, and demandelasticity The government is considering levying a tax of $60 per unit on suppliers of either concert tickets or bus passes. The supply curve for each of these two goods is identical, as you can see on each of the following graphs. The demand for concert tickets is shown by Dc (on the first graph), and the demand for bus passes is shown by Ds (on the second graph)....
Complete the following table with the tax revenue collected and deadweight loss caused by each of the tax proposals.
 3. Relationship between tax revenues, deadweight loss, and demand elasticityThe government is considering levying a tax of $60 per unit on suppliers of either concert tickets or bus passes. The supply curve for each of these two goods is identical, as you can see on each of the following graphs. The demand for concert tickets is shown by DC (on the first graph), and the demand for bus passes is shown by DB (on the second graph).Suppose the government taxes...
Exhibit 5-1 Demand curve Price per unit (dollars) Demand 20 25 30 Quantity 11. In Exhibit...
 Exhibit 5-1 Demand curve Price per unit (dollars) Demand 20 25 30 Quantity 11. In Exhibit 5-1, the demand curve between points a and b is: a price elastic. b. price inelastic. c. unit elastic. d. perfectly elastic. e. perfectly inelastic. 12. Leo's Bakery reduces the price of wheat bread from $3 to $1 and finds that quantity demanded increases from 100 to 122 loaves. Leo calculates that his price elasticity of demand for wheat bread is: a. 0. b....
Price (dollars per unit) 10- 8- When the price is $4 a unit, demand is perfectly...
 Price (dollars per unit) 10- 8- When the price is $4 a unit, demand is perfectly elastic. Draw the demand curve for this good. Label it D. When the quantity demanded is 3 million units a year, demand is perfectly inelastic Draw the demand curve for this good. Label it D2. When the price is $8 a unit, the quantity demanded is 1 million units a year, and demand is unit elastic. Draw the demand curve for this good. Label...
1. Consider oil which has a PED of -0.4. What does this number mean? A. Oil...
1. Consider oil which has a PED of -0.4. What does this number mean? A. Oil demand is elastic B. Oil demand is inelastic C. A 1% increase in the price of oil causes a 0.4% increase in the quantity demanded D. An increase in the price of oil causes the demand for oil to shift right E. Oil supply is highly responsive to changes in the price 2. Consider the market for gas. In the past decade, there has...
 Exhibit 3A-1 Comparison of Market Efficiency and Deadweight Loss 4.00/A 3.50 3.00 2.50 ܙ Price per pound (dollars) 2:00 ܝ 1.00 ܘ 0.50 2 3 4 5 6 Quantity of Ground Beef (millions of pounds per year) As shown in Exhibit 3A-1, if the market is in equilibrium, then total surplus is represented by: a. ABEC + CEFD b. ABEFD - BEF c. CDFE - EFG O d. ABEFD + EFG
 3. (20%) Consider the market was unregulated, with an equilibrium price of $200, and a quantity of 20,000 The supply curve is perfectly inelastic, while the demand curve is perfectly elastic. (a) What burden of taxation falls on producers (this is an amount from $0 to $16)?3 (b) What is the Deadweight Loss from the tax? a tax on producers of $16 per unit. Before the tax's imposition,
3. (20%) Consider the market was unregulated, with an equilibrium price of...
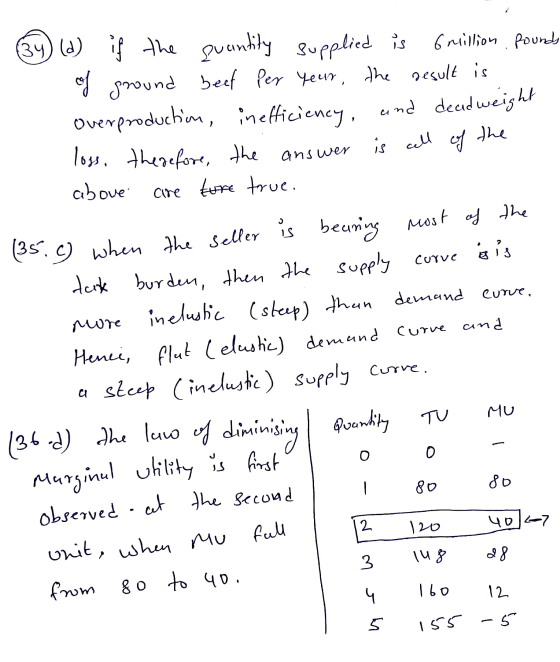
3. (20%) Consider the market was unregulated, with an equilibrium price of $200, and a quantity of 20,000 The supply curve is perfectly inelastic, while the demand curve is perfectly elastic. (a) What burden of taxation falls on producers (this is an amount from $0 to $16)?3 (b) What is the Deadweight Loss from the tax? a tax on producers of $16 per unit. Before the tax's imposition,
3. (20%) Consider the market was unregulated, with an equilibrium price of...
 QUESTION 6 The deadweight loss associated with a per-unit tax will be small relative to the tax revenue collected if: supply and demand are both elastic. O A. supply and demand are both inelastic. OB. supply is elastic, demand is inelastic. OC demand is elastic, supply is inelastic. OD. QUESTION 7 Consider the following statements when answering this question 1. It is not possible to help consumers by simply shifting taxes from consumers paying them to producers paying them. II....
 Homework (Ch 08) 3. Relationship between tax revenues, deadweight loss, and demandelasticity The government is considering levying a tax of $60 per unit on suppliers of either concert tickets or bus passes. The supply curve for each of these two goods is identical, as you can see on each of the following graphs. The demand for concert tickets is shown by Dc (on the first graph), and the demand for bus passes is shown by Ds (on the second graph)....
 Exhibit 5-1 Demand curve Price per unit (dollars) Demand 20 25 30 Quantity 11. In Exhibit 5-1, the demand curve between points a and b is: a price elastic. b. price inelastic. c. unit elastic. d. perfectly elastic. e. perfectly inelastic. 12. Leo's Bakery reduces the price of wheat bread from $3 to $1 and finds that quantity demanded increases from 100 to 122 loaves. Leo calculates that his price elasticity of demand for wheat bread is: a. 0. b....
 Price (dollars per unit) 10- 8- When the price is $4 a unit, demand is perfectly elastic. Draw the demand curve for this good. Label it D. When the quantity demanded is 3 million units a year, demand is perfectly inelastic Draw the demand curve for this good. Label it D2. When the price is $8 a unit, the quantity demanded is 1 million units a year, and demand is unit elastic. Draw the demand curve for this good. Label...
Most questions answered within 3 hours.
-
The average length of time between arrivals at a turnpike
toll-booth is 26 seconds. What is...
asked 42 minutes ago -
(a) A piston at 6.1 atm contains a gas that occupies a volume of
3.5 L....
asked 1 hour ago -
Please answer true or false. Words
cannot be changed or added in to make it true...
asked 1 hour ago -
An empty test tube weighs 15.923 grams. Then,
MgCl2•6H2O is added into the test tube. After...
asked 1 hour ago -
Assume memory access is 10 units of time and disk access is
10000 units of time....
asked 2 hours ago -
1. Are all good samples random?
2. Magazines often report surveys giving statistics such as “63%...
asked 2 hours ago -
Under all the various types of market structures, firms
must eventually earn some economic profits for...
asked 2 hours ago -
Consider the following fitness regime for a single locus trait
with two co-dominant alleles: w11 =...
asked 2 hours ago -
A large cable company reports the following.
80% of its customers subscribe to its cable TV...
asked 2 hours ago -
Please answer the question in brief.
Discuss the role of ERP in organizations. Are ERP tools...
asked 2 hours ago -
Discuss the pros and cons of collaborative software such
as SameTime. Does it increase productivity? What...
asked 2 hours ago -
Buying your in-laws a gift because it’s expected is
due to the ____________ motive of gift-giving....
asked 2 hours ago