Use Only the 2017 and 2018 financial data below to estimate the FIXED COST to Variable...
Use Only the 2017 and 2018 financial data below to estimate the FIXED COST to Variable cost ratio for of goods sold IN 2017. Round to the NEAR whole penny. Use the Hi-Low Method but assume the estimated variable cost is $0.25 per sales dollar.
| Year | 2016 | 2017 | 2018 |
| Total Revenue | 5,354,000 | 6,423,000 | 7,424,000 |
| Cost of Revenue | 2,460,000 | 2,136,000 | 2,265,000 |
| Gross Profit | 2,894,000 | 4,287,000 | 5,159,000 |
| Selling General and Administrative | 410,000 | 395,000 | 431,000 |
| Total Operating Expenses | 3,017,000 | 2,948,000 | 3,184,000 |
Homework Answers
The answer has been presented in the supporting shèet. All the
parts has been solved with detailed explanation and calculation.
For detailed answer refer to the supporting shèet.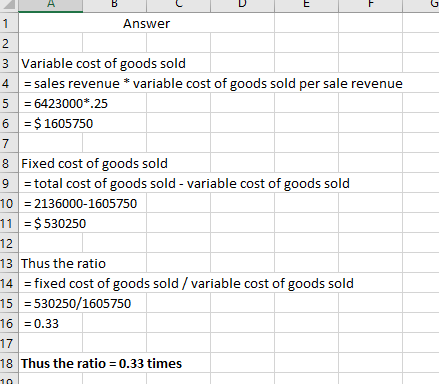
Add Answer to:
Use Only the 2017 and 2018 financial data below to estimate
the FIXED COST to Variable...
Use Only the 2017 and 2018 financial data below to estimate the FIXED COST to Variable...
Use Only the 2017 and 2018 financial data below to estimate the FIXED COST to Variable cost ratio for Selling and Administrative Expenses in 2018. Round to the third decimal place. Use the Hi-Low Method but assume the estimated variable SGA cost is $0.09 per sales dollar. Year 2016 2017 2018 Total Revenue 5,354,000 6,423,000 7,424,000 Cost of Revenue 2,460,000 2,136,000 2,265,000 Gross Profit 2,894,000 4,287,000 5,159,000 Selling General and Administrative 410,000 395,000 431,000 Total Operating Expenses 3,017,000 2,948,000 3,184,000
Use Only the 2017 and 2018 financial data below to compute (properly) the Total variable Selling...
Use Only the 2017 and 2018 financial data below to compute (properly) the Total variable Selling and Administrative Costs in 2018. Round to Nearest whole dollar. Use the Hi-Low Method. Year 2016 2017 2018 Total Revenue 5,354,000 6,423,000 7,424,000 Cost of Revenue 2,460,000 2,136,000 2,265,000 Gross Profit 2,894,000 4,287,000 5,159,000 Selling General and Administrative 410,000 395,000 431,000 Total Operating Expenses 3,017,000 2,948,000 3,184,000
10 points Save Answer Use Only the 2017 and 2018 financial data below to estimate the...
 10 points Save Answer Use Only the 2017 and 2018 financial data below to estimate the TOTAL FIXED COST of goods sold IN 2017. Round to the NEAR whole dollar. Use the Hi-Low Method but assume the estimated variable cost is $0.25 per sales dollar. Year 2016 2018 Total Revenue 000 7.424,000 ,000 2,265,000 Cost of Revenue 4.287,000 5,159,000 Gross Profit 10,000 395,000 431,000 Solling General and Administrative 3.017,000 2948,000 3,184,000 Total Operating Expenses
UUTTUNU Below is part of Workiva Inc.'s income statements from 2016, 2017, and 2018 $ in thousands Revenue Cost of Reve...
 UUTTUNU Below is part of Workiva Inc.'s income statements from 2016, 2017, and 2018 $ in thousands Revenue Cost of Revenue Gross Profit Research & Development December December December 31, 2018 31, 2017 31, 2016 $244,344 $207,869 $178,646 65,860 60,245 51,625 178,484 147,624 127,021 81,602 68,172 57,438 General & administrative Expenses 90,337 84,161 80,466 Using 2016 as the base year what is the trend percentage of Revenue in 2017? [ Select] Using 2016 as the base year what is the...
Question 3 2.5 pts Below is part of Workiva Inc.'s income statements from 2016, 2017, and 2018 Sin thousands Decemb...
 Question 3 2.5 pts Below is part of Workiva Inc.'s income statements from 2016, 2017, and 2018 Sin thousands December 31, December 31, December 2018 2017 31, 2016 Revenue $244,344 $207,869 $178,646 Cost of Revenue 65,860 60,245 51,625 Gross Profit 178,484 147,624 127,021 Research & Development 81,602 68,172 57,438 General & administrative 90,337 84,161 80,466 Expenses Using 2016 as the base year what is the trend percentage of Revenue in 2017? Select ] Using 2016 as the base year what...
Operating data for Whispering Winds Corp. are presented below. 2017 2016 $843,200 $649,500 Sales revenue Cost...
 Operating data for Whispering Winds Corp. are presented below. 2017 2016 $843,200 $649,500 Sales revenue Cost of goods sold 530,500 410,300 Selling expenses 124,100 73,600 Administrative expenses 77,200 53,900 Income tax expense 38,900 24,600 Net income 72,500 87,100 Prepare a schedule showing a vertical analysis for 2017 and 2016. (Round percentages to 1 decimal place, e.g. 12.1%) WHISPERING WINDS CORP. Condensed Income Statement 2017 2016 Amount Percent Amount Percent Sales $843,200 $649,500 Cost of goods sold 530,500 410,300 239,200 Gross...
Requirements: - Complete the common-size for 2018 and 2017 for both the balance sheets and income...
 Requirements: - Complete the common-size for 2018 and 2017 for both the balance sheets and income statements (orange shaded areas). - Required; Round each answer to one decimal place (i.e. 46.3%) Rocky Road Bicycles, Inc. Comparative Balance Sheets December 31, 2018 and 2017 Rocky Road Bicycles, Inc. Income Statements For the Years Ended December 31, 2018 and 2017 2018 Common Size 2017 Common Size 2018 Common Size 2017 Common Size $ Assets Cash Account receivable Inventory Prepaid rent Plant assets...
Required 1 Required 2. Use the high-low method to estimate total fixed cost and variable cost...
 Required 1 Required 2. Use the high-low method to estimate total fixed cost and variable cost per cavity filled. (Round your Variable cost per unit to 2 decimal places.) Fixed Cost Variable Cost per cavity filled < Required 1 Required 2 > Mountain Dental Services is a specialized dental practice whose only service is filling cavities. Mountain has recorded the following for the past nine months: Month January February March April May June July August September Number of Cavities Filled...
Exercise 13-4 Operating data for Swifty Corporation are presented below. 2017 2016 Sales revenue $830,700 529,000...
 Exercise 13-4 Operating data for Swifty Corporation are presented below. 2017 2016 Sales revenue $830,700 529,000 124,700 78,800 33,500 64,700 $634,900 415,000 73,600 53,900 23,400 69,000 Cost of goods sold Selling expenses Administrative expenses Income tax expense Net income Prepare a schedule showing a vertical analysis for 2017 and 2016. (Round percentages to 1 decimal place, eg, 12.1%) SWIFTY CORPORATION Condensed Income Statement 2017 2016 Amsunt PerentAmeint Amount % $634,900 96 415,000 % 219,900 Percent Sales Cost of goods sold...
*Exercise 14-2 Operating data for Navarro Corporation are presented below. 2017 2016 Net sales Cost of...
 *Exercise 14-2 Operating data for Navarro Corporation are presented below. 2017 2016 Net sales Cost of goods sold Selling expenses Administrative expenses $ 754,000 469,500 124,500 65,000 30,000 65,000 $ 601,500 389,500 67,500 52,000 25,500 67,000 Income tax expense Net income Prepare a schedule showing a vertical analysis for 2017 and 2016. (Round answers to 1 decimal place, e.g. 48.5%.) NAVARRO CORPORATION Condensed Income Statements For the Years Ended December 31 2017 2016 Amount Percent Amount Percent Net sales $...
 10 points Save Answer Use Only the 2017 and 2018 financial data below to estimate the TOTAL FIXED COST of goods sold IN 2017. Round to the NEAR whole dollar. Use the Hi-Low Method but assume the estimated variable cost is $0.25 per sales dollar. Year 2016 2018 Total Revenue 000 7.424,000 ,000 2,265,000 Cost of Revenue 4.287,000 5,159,000 Gross Profit 10,000 395,000 431,000 Solling General and Administrative 3.017,000 2948,000 3,184,000 Total Operating Expenses
 UUTTUNU Below is part of Workiva Inc.'s income statements from 2016, 2017, and 2018 $ in thousands Revenue Cost of Revenue Gross Profit Research & Development December December December 31, 2018 31, 2017 31, 2016 $244,344 $207,869 $178,646 65,860 60,245 51,625 178,484 147,624 127,021 81,602 68,172 57,438 General & administrative Expenses 90,337 84,161 80,466 Using 2016 as the base year what is the trend percentage of Revenue in 2017? [ Select] Using 2016 as the base year what is the...
 Question 3 2.5 pts Below is part of Workiva Inc.'s income statements from 2016, 2017, and 2018 Sin thousands December 31, December 31, December 2018 2017 31, 2016 Revenue $244,344 $207,869 $178,646 Cost of Revenue 65,860 60,245 51,625 Gross Profit 178,484 147,624 127,021 Research & Development 81,602 68,172 57,438 General & administrative 90,337 84,161 80,466 Expenses Using 2016 as the base year what is the trend percentage of Revenue in 2017? Select ] Using 2016 as the base year what...
 Operating data for Whispering Winds Corp. are presented below. 2017 2016 $843,200 $649,500 Sales revenue Cost of goods sold 530,500 410,300 Selling expenses 124,100 73,600 Administrative expenses 77,200 53,900 Income tax expense 38,900 24,600 Net income 72,500 87,100 Prepare a schedule showing a vertical analysis for 2017 and 2016. (Round percentages to 1 decimal place, e.g. 12.1%) WHISPERING WINDS CORP. Condensed Income Statement 2017 2016 Amount Percent Amount Percent Sales $843,200 $649,500 Cost of goods sold 530,500 410,300 239,200 Gross...
 Requirements: - Complete the common-size for 2018 and 2017 for both the balance sheets and income statements (orange shaded areas). - Required; Round each answer to one decimal place (i.e. 46.3%) Rocky Road Bicycles, Inc. Comparative Balance Sheets December 31, 2018 and 2017 Rocky Road Bicycles, Inc. Income Statements For the Years Ended December 31, 2018 and 2017 2018 Common Size 2017 Common Size 2018 Common Size 2017 Common Size $ Assets Cash Account receivable Inventory Prepaid rent Plant assets...
 Required 1 Required 2. Use the high-low method to estimate total fixed cost and variable cost per cavity filled. (Round your Variable cost per unit to 2 decimal places.) Fixed Cost Variable Cost per cavity filled < Required 1 Required 2 > Mountain Dental Services is a specialized dental practice whose only service is filling cavities. Mountain has recorded the following for the past nine months: Month January February March April May June July August September Number of Cavities Filled...
 Exercise 13-4 Operating data for Swifty Corporation are presented below. 2017 2016 Sales revenue $830,700 529,000 124,700 78,800 33,500 64,700 $634,900 415,000 73,600 53,900 23,400 69,000 Cost of goods sold Selling expenses Administrative expenses Income tax expense Net income Prepare a schedule showing a vertical analysis for 2017 and 2016. (Round percentages to 1 decimal place, eg, 12.1%) SWIFTY CORPORATION Condensed Income Statement 2017 2016 Amsunt PerentAmeint Amount % $634,900 96 415,000 % 219,900 Percent Sales Cost of goods sold...
 *Exercise 14-2 Operating data for Navarro Corporation are presented below. 2017 2016 Net sales Cost of goods sold Selling expenses Administrative expenses $ 754,000 469,500 124,500 65,000 30,000 65,000 $ 601,500 389,500 67,500 52,000 25,500 67,000 Income tax expense Net income Prepare a schedule showing a vertical analysis for 2017 and 2016. (Round answers to 1 decimal place, e.g. 48.5%.) NAVARRO CORPORATION Condensed Income Statements For the Years Ended December 31 2017 2016 Amount Percent Amount Percent Net sales $...
Most questions answered within 3 hours.
-
The random variable X is exponentially distributed, where X
represents the time it takes for a...
asked 18 seconds from now -
MATLAB
write a MATLAB function (1) output a third-order polynomial
function with the coefficients as the...
asked 7 minutes ago -
A z-score
communicates a raw score’s "relative standing"
under the normal curve in relation to:
asked 15 minutes ago -
An object is vibrating on a spring with the following equation
of motion:
?=(30 ??)cos((2?)/(160)?)
a)...
asked 15 minutes ago -
Vulcan Flyovers offers scenic overflights of Mount St. Helens,
the volcano in Washington State that explosively...
asked 17 minutes ago -
If organizations do not adapt fast enough and move incrementally
from the twentieth-century model to the...
asked 18 minutes ago -
A helium balloon with 2.5L of gas has a gauge pressure of 10,000
Pa. The balloon...
asked 22 minutes ago -
What is responsible for Jupiter's enormous magnetic field?
asked 37 minutes ago -
At the end of the year, a company offered to buy 5,000 units of
a product...
asked 39 minutes ago -
Implement C++ program for each of the following.
Let D = [-48, -14, -8, 0, 1,...
asked 59 minutes ago -
Consider a labor market in which LD = 400 – 4W and LS = 250 +...
asked 1 hour ago -
Let’s say you are teaching a typically-developing young child
how to eat with a spoon. Describe...
asked 56 minutes ago