

Homework Answers
a. Suppose the market equilibrium is where the supply
and demand curve intersects at point E1 with respect to
which market equilibrium price is $1.50 and market equilibrium
quantity is 300 units. Now at price level Po, I.e at price level of
$1, quantity demanded is Qod I.e 400 units and quantity
supplied is Qos I.e 100 units, hence as at Po quantity
demanded exceeds quantity supplied, hence at price level Po there
exists a shortage of (Qod-Qos)= ( 400-100)=
300 units.

b. Now as Kringle and coffee are complements in consumption, as
price of Kringle decreases, people will consume more of coffee and
hence demand for coffee will increase and the demand curve will
shift rightward from D1 to D2 and as the economy moves from point
E1 to point E2, the equilibrium price of
coffee will increase from P1 to P2 and the equilibrium quantity of
coffee consumption will increase from Q1 to Q2.
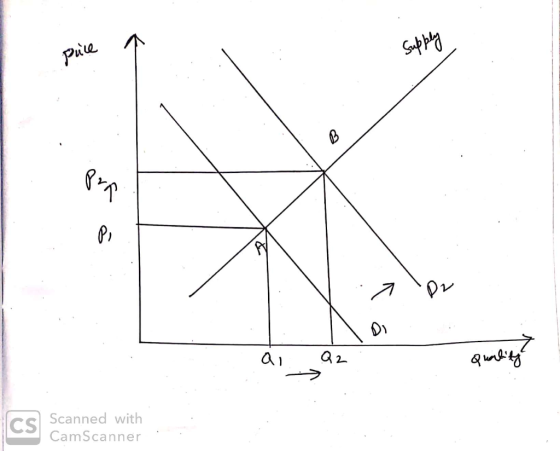
2. As Spam is an inferior good, which means that income
elasticity of demand for spam is negative. Hence as
consumer’s income increases, demand for spam will
decline. Thus here as consumer income increases, demand for spam
falls, and the demand curve will shift leftward from D1 to D2 and
as the economy moves from point A to point B, the equilibrium price
of Spam will decline from P1 to P2 and the equilibrium quantity of
Spam will decline from Q1 to Q2.

3. As apples and bananas are substitutes in consumption,
thus as price of bananas increase, then consumers will switch to
apple consumption and hence the demand for apples will increase and
the demand curve for apples will shift rightward from D1 to D2 and
as the economy moves from point A to point B, the equilibrium price
of apples will increase from P1 to P2 and the equilibrium quantity
of apples will increase from Q1 to Q2.

Add Answer to:
1. Suppose that the initial demand and supply curves for coffee are illustrate by D' and...
For Problems 1 and 2, illustrate and explain (and label) the effects of the change in...
 For Problems 1 and 2, illustrate and explain (and label) the effects of the change in the determinant of demand or supply on the market equilibrium price and quantity, ceteris poribus (c. p.). For each change: • illustrate the effect on the demand or supply curve and clearly label the new curve (2 pts); . given the change in demand or supply, illustrate the quantity demanded, labeled as a', and the quantity supplied, labeled as Q', at the initial market...
1. Numerical analysis of supply and demand: Consider the following demand and supply functions that provide...
 1. Numerical analysis of supply and demand: Consider the following demand and supply functions that provide information on the market for coffee beans: Qd 50-2PPr Qs 10+3P where P is the price per pound of coffee beans, Pr is the price per pound of tea, and Qd and Qs are the quantity demanded and the quantity supplied of coffee beans in thousands of pounds. a Assuming that Pr 10, graph the market with a clearly labeled graph and calculate the...
1. Numerical analysis of supply and demand: Consider the following demand and supply functions that provide...
 1. Numerical analysis of supply and demand: Consider the following demand and supply functions that provide information on the market for coffee beans: Qd 50- 2P PT Qs 10+3P where P is the price per pound of coffee beans, Pr is the price per pound of tea, and Qd and Qs are the quantity demanded and the quantity supplied of coffee beans in thousands of pounds. (a) Assuming that Pr 10, graph the market with a clearly labeled graph and...
2. Suppose that cow's milk and organic fertilizer (ie, the manure produced by dairy cows) are...
 2. Suppose that cow's milk and organic fertilizer (ie, the manure produced by dairy cows) are joint products in production and independent in consumption. Assume that milk is a normal good and that organic fertilizer (manure) is independent of income te., fertilizer demand does not change when income changes) Suppose that consumer income decreases. Hlustrate and explain the resulting effects on the market equilibrium price and quantity in both the milk market and the organic fertilizer (manure) market. In each...
[10 points] Suppose the market demand and market supply curves for coffee are given by the...
 [10 points] Suppose the market demand and market supply curves for coffee are given by the following equations where P is the price per cup of coffee and Qc is the quantity of billion cups of coffee: Market Demand for Coffee: QD = 120 – 6P Market Supply of Coffee: Qs = -10 + 20P a. [2 points) What is the equilibrium price and equilibrium of coffee given the above information? Suppose the quantity of coffee supplied at every price...
Suppose that (cow's) milk and organic fertilizer (i.e., the manure produced by dairy cows) are joint products and...
 Suppose that (cow's) milk and organic fertilizer (i.e., the manure produced by dairy cows) are joint products and independent in consumption. Assume that milk is a normal good and that organic fertilizer (manure) is independent of income (i.e., fertilizer demand does not change when income changes). Suppose that consumer Income Increases. Illustrate and explain the resulting effects on the market equilibrium price and quantity in both the milk market and the organic fertilizer (manure) market. In each market, clearly illustrate...
1. Suppose the total demand for wheat and the total supply of wheat per month in...
 1. Suppose the total demand for wheat and the total supply of wheat per month in the Kansas City grain market are as shown in the table below. Thousands of Bushels Demanded Price Thousands of Bushels Supplied 85 $3. 70 80 $ 4 80 75 $ 5 90 70 $6 100 65 $ 7 110 60 $ 8 120 a. What is the equilibrium price? b. At what price is there neither a shortage nor a surplus? c. Fill in...
E) Solve the mathematical problems below: 1. The demand and supply curves for hotdogs in California...
 E) Solve the mathematical problems below: 1. The demand and supply curves for hotdogs in California are given by the following two equations QD = 8,000 - 800P QS = 2,000 + 200P Where QD represents quantity demanded, QS represents quantity supplied and P represents price. a. Find the equilibrium quantity and price: b. If students suddenly acquire a greater taste for hotdogs, which of the following would be the new demand curve? Circle the correct equation: QD = 6,500...
Supply & Demand, Equilibrium, and Surplus 1. Consider a specific market for smart phone plans (not...
 Supply & Demand, Equilibrium, and Surplus 1. Consider a specific market for smart phone plans (not the phones) in a small town. Here are the conditions: Q = 50 – 0.5 * P Q = –25 + P a. Is the first one the supply or demand curve? How can you tell? (hint: solve for P first) b. At what price will the market be in equilibrium? How many transactions (quantity) will take place? c. If the current price is...
Unit 7-Market Intervention: Price Ceilings and Floors, Taxes Suppose that the demand curve for coffee is...
 Unit 7-Market Intervention: Price Ceilings and Floors, Taxes Suppose that the demand curve for coffee is Q-10-P and the supply curve is Q = P. Draw the supply and demand curves below. 107 NWU 3 4 5 6 7 8 9 10 1. What is the equilibrium price and quantity? 2. What is total surplus, consumer surplus, and producer surplus? 3. Suppose the government implemented a price floor at $7 per cup of coffee. a. Identify the new quantities demanded...
 For Problems 1 and 2, illustrate and explain (and label) the effects of the change in the determinant of demand or supply on the market equilibrium price and quantity, ceteris poribus (c. p.). For each change: • illustrate the effect on the demand or supply curve and clearly label the new curve (2 pts); . given the change in demand or supply, illustrate the quantity demanded, labeled as a', and the quantity supplied, labeled as Q', at the initial market...
 1. Numerical analysis of supply and demand: Consider the following demand and supply functions that provide information on the market for coffee beans: Qd 50-2PPr Qs 10+3P where P is the price per pound of coffee beans, Pr is the price per pound of tea, and Qd and Qs are the quantity demanded and the quantity supplied of coffee beans in thousands of pounds. a Assuming that Pr 10, graph the market with a clearly labeled graph and calculate the...
 1. Numerical analysis of supply and demand: Consider the following demand and supply functions that provide information on the market for coffee beans: Qd 50- 2P PT Qs 10+3P where P is the price per pound of coffee beans, Pr is the price per pound of tea, and Qd and Qs are the quantity demanded and the quantity supplied of coffee beans in thousands of pounds. (a) Assuming that Pr 10, graph the market with a clearly labeled graph and...
 2. Suppose that cow's milk and organic fertilizer (ie, the manure produced by dairy cows) are joint products in production and independent in consumption. Assume that milk is a normal good and that organic fertilizer (manure) is independent of income te., fertilizer demand does not change when income changes) Suppose that consumer income decreases. Hlustrate and explain the resulting effects on the market equilibrium price and quantity in both the milk market and the organic fertilizer (manure) market. In each...
 [10 points] Suppose the market demand and market supply curves for coffee are given by the following equations where P is the price per cup of coffee and Qc is the quantity of billion cups of coffee: Market Demand for Coffee: QD = 120 – 6P Market Supply of Coffee: Qs = -10 + 20P a. [2 points) What is the equilibrium price and equilibrium of coffee given the above information? Suppose the quantity of coffee supplied at every price...
 Suppose that (cow's) milk and organic fertilizer (i.e., the manure produced by dairy cows) are joint products and independent in consumption. Assume that milk is a normal good and that organic fertilizer (manure) is independent of income (i.e., fertilizer demand does not change when income changes). Suppose that consumer Income Increases. Illustrate and explain the resulting effects on the market equilibrium price and quantity in both the milk market and the organic fertilizer (manure) market. In each market, clearly illustrate...
 1. Suppose the total demand for wheat and the total supply of wheat per month in the Kansas City grain market are as shown in the table below. Thousands of Bushels Demanded Price Thousands of Bushels Supplied 85 $3. 70 80 $ 4 80 75 $ 5 90 70 $6 100 65 $ 7 110 60 $ 8 120 a. What is the equilibrium price? b. At what price is there neither a shortage nor a surplus? c. Fill in...
 E) Solve the mathematical problems below: 1. The demand and supply curves for hotdogs in California are given by the following two equations QD = 8,000 - 800P QS = 2,000 + 200P Where QD represents quantity demanded, QS represents quantity supplied and P represents price. a. Find the equilibrium quantity and price: b. If students suddenly acquire a greater taste for hotdogs, which of the following would be the new demand curve? Circle the correct equation: QD = 6,500...
 Supply & Demand, Equilibrium, and Surplus 1. Consider a specific market for smart phone plans (not the phones) in a small town. Here are the conditions: Q = 50 – 0.5 * P Q = –25 + P a. Is the first one the supply or demand curve? How can you tell? (hint: solve for P first) b. At what price will the market be in equilibrium? How many transactions (quantity) will take place? c. If the current price is...
 Unit 7-Market Intervention: Price Ceilings and Floors, Taxes Suppose that the demand curve for coffee is Q-10-P and the supply curve is Q = P. Draw the supply and demand curves below. 107 NWU 3 4 5 6 7 8 9 10 1. What is the equilibrium price and quantity? 2. What is total surplus, consumer surplus, and producer surplus? 3. Suppose the government implemented a price floor at $7 per cup of coffee. a. Identify the new quantities demanded...
Most questions answered within 3 hours.
-
Explain Mertons concept of anomie is and what the
modes of adaptation to it are?
asked 43 minutes ago -
Jamie is doing a survey at her school about whether the students
feel the cafeteria food...
asked 2 hours ago -
How many liters of 0.669 M KOH will be needed to raise the pH of
0.339...
asked 4 hours ago -
A liquid of density 1270 kg/m 3 flows steadily through a pipe of
varying diameter and...
asked 4 hours ago -
Questions: What should the American executive do?
'A visiting American executive finds that a foreign subsidiary...
asked 4 hours ago -
Activity based costing was introduced as an alternative to
absorption costing.
1. Discuss using illustration the...
asked 4 hours ago -
1. You own shares of Crane DVD Company and are interested in
selling them. With so...
asked 4 hours ago -
How many grams of He are necessary to fill a balloon having a
volume of 4.5E3...
asked 4 hours ago -
The 2 patients, still in the hospital, were interviewed by a
MoH epidemiologist. The interviews revealed...
asked 4 hours ago -
An uncharged capacitor and a resistor are connected in series to
a source of emf. If...
asked 5 hours ago -
If assets are $540,000 and liabilities are $236,000 what is the
amount of owner’s equity?
asked 5 hours ago -
MATH 3421 Maple Assignment 1 Due February 13, 2019 Maple is a
Computer Algebra System that...
asked 5 hours ago