Measures of liquidity, Solvency, and Profitability The comparative financial statements of Marshall Inc. are as follows....
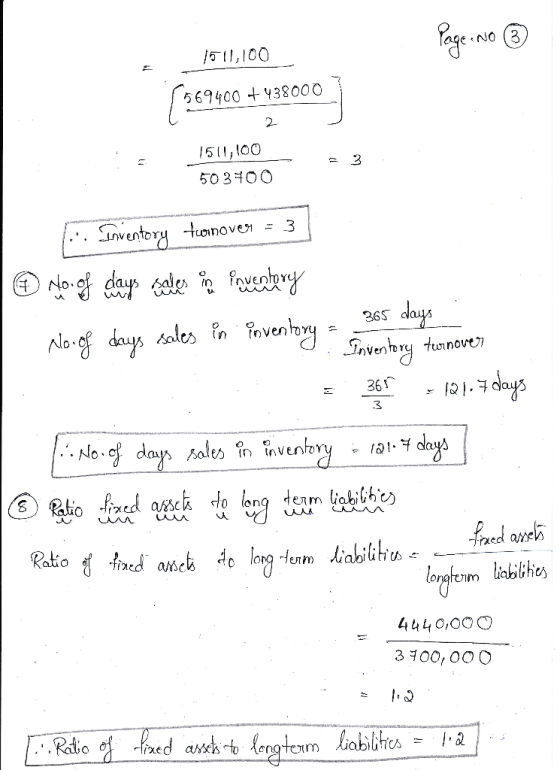
Measures of liquidity, Solvency, and Profitability The comparative financial statements of Marshall Inc. are as follows. The market price of Marshall common stock was $ 56 on December 31, 20Y2. Marshall Inc. Comparative Retained Earnings Statement For the Years Ended December 31, 20Y2 and 20Y1 20Y2 20Y1 Retained earnings, January 1 $2,715,500 $2,304,500 Net income 630,000 472,000 Total $3,345,500 $2,776,500 Dividends: On preferred stock $9,800 $9,800 On common stock 51,200 51,200 Total dividends $61,000 $61,000 Retained earnings, December 31 $3,284,500 $2,715,500 Marshall Inc. Comparative Income Statement For the Years Ended December 31, 20Y2 and 20Y1 20Y2 20Y1 Sales $4,015,000 $3,699,250 Cost of goods sold 1,511,100 1,390,210 Gross profit $2,503,900 $2,309,040 Selling expenses $833,000 $1,040,630 Administrative expenses 709,600 611,160 Total operating expenses $1,542,600 $1,651,790 Income from operations $961,300 $657,250 Other revenue 50,600 41,950 $1,011,900 $699,200 Other expense (interest) 296,000 163,200 Income before income tax $715,900 $536,000 Income tax expense 85,900 64,000 Net income $630,000 $472,000 Marshall Inc. Comparative Balance Sheet December 31, 20Y2 and 20Y1 20Y2 20Y1 Assets Current assets Cash $970,930 $641,710 Marketable securities 1,469,520 1,063,420 Accounts receivable (net) 751,900 708,100 Inventories 569,400 438,000 Prepaid expenses 183,690 128,340 Total current assets $3,945,440 $2,979,570 Long-term investments 1,032,010 291,665 Property, plant, and equipment (net) 4,440,000 3,996,000 Total assets $9,417,450 $7,267,235 Liabilities Current liabilities $1,232,950 $1,311,735 Long-term liabilities: Mortgage note payable, 8% $1,660,000 $0 Bonds payable, 8% 2,040,000 2,040,000 Total long-term liabilities $3,700,000 $2,040,000 Total liabilities $4,932,950 $3,351,735 Stockholders' Equity Preferred $0.70 stock, $40 par $560,000 $560,000 Common stock, $10 par 640,000 640,000 Retained earnings 3,284,500 2,715,500 Total stockholders' equity $4,484,500 $3,915,500 Total liabilities and stockholders' equity $9,417,450 $7,267,235 Required: Determine the following measures for 20Y2, rounding to one decimal place, except for dollar amounts, which should be rounded to the nearest cent. Use the rounded answer of the requirement for subsequent requirement, if required. Assume 365 days a year. 1. Working capital $ 2,712,490 2. Current ratio 3.2 3. Quick ratio 2.5 4. Accounts receivable turnover 3.6 5. Number of days' sales in receivables 101.3 days 6. Inventory turnover 1.9 7. Number of days' sales in inventory 192.1 days 8. Ratio of fixed assets to long-term liabilities 1.2 9. Ratio of liabilities to stockholders' equity 1.1 10. Times interest earned 3.4 11. Asset turnover 0.48 12. Return on total assets % 13. Return on stockholders’ equity % 14. Return on common stockholders’ equity % 15. Earnings per share on common stock $ 16. Price-earnings ratio 17. Dividends per share of common stock $ 18. Dividend yield % Check My Work2 more Check My Work uses remaining.
Homework Answers


Add Answer to:
Measures of liquidity, Solvency, and Profitability The
comparative financial statements of Marshall Inc. are as follows....
Measures of liquidity, Solvency and Profitability The comparative financial statements of Marshall Inc. are as follows....
Measures of liquidity, Solvency and Profitability The comparative financial statements of Marshall Inc. are as follows. The market price of Marshall Inc. common stock was $ 59 on December 31, 20Y2. Marshall Inc. Comparative Retained Earnings Statement For the Years Ended December 31, 20Y2 and 20Y1 20Y2 20Y1 Retained earnings, January 1 $ 1,659,275 $ 1,404,525 Net income 374,400 287,700 Total $ 2,033,675 $ 1,692,225 Dividends On preferred stock $ 6,300 $ 6,300 On common stock 26,650 26,650 Total dividends...
Measures of liquidity, Solvency and Profitability The comparative financial statements of Marshall Inc. are as follows....
 Measures of liquidity, Solvency and Profitability The comparative financial statements of Marshall Inc. are as follows. The market price of Marshall Inc. common stock was $ 68 on December 31, 20Y2. Marshall Inc. Comparative Retained Earnings Statement For the Years Ended December 31, 20Y2 and 20Y1 2012 20Y1 Retained earnings, January 1 $ 1,190,000 $ 1,407,900 330,000 Net income 243,700 Total $ 1,737,900 $ 1,433,700 Dividends $ 10,500 $ 10,500 15,300 15,300 On preferred stock On common stock Total dividends...
Measures of liquidity, Solvency and Profitability The comparative financial statements of Marshall Inc. are as follows....
Measures of liquidity, Solvency and Profitability The comparative financial statements of Marshall Inc. are as follows. The market price of Marshall common stock was $ 62 on December 31, 20Y2. Marshall Inc. Comparative Retained Earnings Statement For the Years Ended December 31, 20Y2 and 20Y1 20Y2 20Y1 Retained earnings, January 1 $ 2,842,400 $ 2,417,000 Net income 624,800 495,000 Total $3,467,200 $ 2,912,000 Dividends: On preferred stock $ 8,400 $ 8,400 On common stock 61,200 61,200 Total dividends $ 69,600...
Measures of liquidity, Solvency, and Profitability The comparative financial statements of Marshall Inc. are as follows....
Measures of liquidity, Solvency, and Profitability The comparative financial statements of Marshall Inc. are as follows. The market price of Marshall common stock was $ 63 on December 31, 20Y2. Marshall Inc. Comparative Retained Earnings Statement For the Years Ended December 31, 20Y2 and 20Y1 20Y2 20Y1 Retained earnings, January 1 $1,022,050 $862,950 Net income 233,600 176,800 Total $1,255,650 $1,039,750 Dividends: On preferred stock $7,700 $7,700 On common stock 10,000 10,000 Total dividends $17,700 $17,700 Retained earnings, December 31 $1,237,950...
Measures of liquidity, Solvency, and Profitability The comparative financial statements of Marshall Inc. are as follows....
Measures of liquidity, Solvency, and Profitability The comparative financial statements of Marshall Inc. are as follows. The market price of Marshall common stock was $ 58 on December 31, 20Y2. Marshall Inc. Comparative Retained Earnings Statement For the Years Ended December 31, 20Y2 and 20Y1 20Y2 20Y1 Retained earnings, January 1 $1,802,125 $1,537,175 Net income 425,600 314,800 Total $2,227,725 $1,851,975 Dividends: On preferred stock $13,300 $13,300 On common stock 36,550 36,550 Total dividends $49,850 $49,850 Retained earnings, December 31 $2,177,875...
Measures of liquidity, Solvency, and Profitability The comparative financial statements of Marshall Inc. are as follows....
Measures of liquidity, Solvency, and Profitability The comparative financial statements of Marshall Inc. are as follows. The market price of Marshall common stock was $ 56 on December 31, 20Y2. Marshall Inc. Comparative Retained Earnings Statement For the Years Ended December 31, 20Y2 and 20Y1 20Y2 20Y1 Retained earnings, January 1 $1,793,525 $1,515,775 Net income 425,600 310,400 Total $2,219,125 $1,826,175 Dividends: On preferred stock $13,300 $13,300 On common stock 19,350 19,350 Total dividends $32,650 $32,650 Retained earnings, December 31 $2,186,475...
Measures of liquidity, Solvency, and Profitability The comparative financial statements of Marshall Inc. are as follows....
Measures of liquidity, Solvency, and Profitability The comparative financial statements of Marshall Inc. are as follows. The market price of Marshall common stock was $ 63 on December 31, 20Y2. Marshall Inc. Comparative Retained Earnings Statement For the Years Ended December 31, 20Y2 and 20Y1 20Y2 20Y1 Retained earnings, January 1 $1,315,800 $1,118,300 Net income 280,000 229,100 Total $1,595,800 $1,347,400 Dividends: On preferred stock $9,100 $9,100 On common stock 22,500 22,500 Total dividends $31,600 $31,600 Retained earnings, December 31 $1,564,200...
Measures of liquidity, Solvency, and Profitability The comparative financial statements of Marshall Inc. are as follows....
Measures of liquidity, Solvency, and Profitability The comparative financial statements of Marshall Inc. are as follows. The market price of Marshall common stock was $ 54 on December 31, 20Y2. Marshall Inc. Comparative Retained Earnings Statement For the Years Ended December 31, 20Y2 and 20Y1 20Y2 20Y1 Retained earnings, January 1 $3,215,200 $2,727,000 Net income 720,000 558,600 Total $3,935,200 $3,285,600 Dividends: On preferred stock $11,900 $11,900 On common stock 58,500 58,500 Total dividends $70,400 $70,400 Retained earnings, December 31 $3,864,800...
Measures of liquidity, Solvency, and Profitability The comparative financial statements of Marshall Inc. are as follows....
Measures of liquidity, Solvency, and Profitability The comparative financial statements of Marshall Inc. are as follows. The market price of Marshall common stock was $ 57 on December 31, 20Y2. Marshall Inc. Comparative Retained Earnings Statement For the Years Ended December 31, 20Y2 and 20Y1 20Y2 20Y1 Retained earnings, January 1 $1,692,975 $1,439,325 Net income 395,200 294,800 Total $2,088,175 $1,734,125 Dividends: On preferred stock $11,900 $11,900 On common stock 29,250 29,250 Total dividends $41,150 $41,150 Retained earnings, December 31 $2,047,025...
 Measures of liquidity, Solvency and Profitability The comparative financial statements of Marshall Inc. are as follows. The market price of Marshall Inc. common stock was $ 68 on December 31, 20Y2. Marshall Inc. Comparative Retained Earnings Statement For the Years Ended December 31, 20Y2 and 20Y1 2012 20Y1 Retained earnings, January 1 $ 1,190,000 $ 1,407,900 330,000 Net income 243,700 Total $ 1,737,900 $ 1,433,700 Dividends $ 10,500 $ 10,500 15,300 15,300 On preferred stock On common stock Total dividends...
 Measures of liquidity, Solvency and Profitability The comparative financial statements of Marshall Inc. are as follows. The market price of Marshall Inc. common stock was $ 68 on December 31, 20Y2. Marshall Inc. Comparative Retained Earnings Statement For the Years Ended December 31, 20Y2 and 20Y1 2012 20Y1 Retained earnings, January 1 $ 1,190,000 $ 1,407,900 330,000 Net income 243,700 Total $ 1,737,900 $ 1,433,700 Dividends $ 10,500 $ 10,500 15,300 15,300 On preferred stock On common stock Total dividends...
Most questions answered within 3 hours.
-
A second baseman tosses the ball to the first baseman, who
catches it at the same...
asked 6 minutes ago -
An object rests flat on a tablecloth, which is on top of a
table. Suppose you...
asked 5 minutes ago -
Which of the following will most likely occur as the result of
an unanticipated increase in...
asked 2 minutes ago -
Adria Lopez, owner of Success Systems, decides to prepare a
statement of cash flows for her...
asked 25 minutes ago -
The reach and involvement of the federal government, in terms of
its role in disaster relief,...
asked 28 minutes ago -
Problem: The equilibrium constant, Keq, is 5 x 10^-11 m HCO3
<-----------> H^+ + CO3^-2 Calculate...
asked 35 minutes ago -
Explain how blackbody radiation led to the idea of "quanta."
Will rate answer!
asked 40 minutes ago -
Two noble gases (Ne and He) are injected into the chambers of an
insulated container. Each...
asked 35 minutes ago -
Suppose you purchase a zero coupon bond with a face value of
$1,000, maturing in 18...
asked 40 minutes ago -
Do you believe that the $785,000 amount at the center of the
Overstock-Grant Thornton dispute was...
asked 41 minutes ago -
Find and , the mean and standard deviation of the
sampling distribution of :
μ = 25,...
asked 1 hour ago -
According to the manufacturer of a certain candy, 9% of the
candy produced are red. If...
asked 1 hour ago