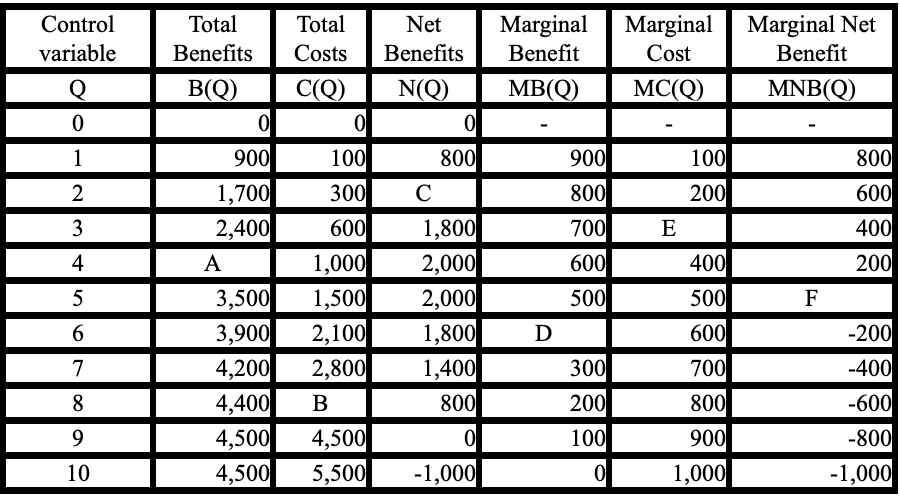
Total costs in the table are:
Select one:
a. decreasing at a decreasing rate.
b. decreasing at a constant rate.
c. increasing at a constant rate.
d. increasing at an increasing rate.
Homework Answers
The correct option is d.) increasing at an increasing rate.
Total costs in the table is increasing at an increasing rate.
Net Benefit= Total Benefit- Total Costs
Net Benefit at 8 units of control variable= Total Benefit- Total Cost
800=4400-Total cost
Therefore, Total Cost= $3600
Total Cost Marginal cost
0 -
100 100
300 200
600 300
1000 400
1500 500
2100 600
2800 700
3600 800
4500 900
5500 1000
Marginal cost represents the slope of the total cost. It tell us at which rate total cost is increasing or decreasing.
In this table, Total cost is increasing at a increasing rate.It is because total cost is increasing and marginal cost is also increasing. It means that total cost is increasing at an increasing rate.
Add Answer to:
Total costs in the table are:
Select one:
a. decreasing at a decreasing rate.
b. decreasing...
What is the marginal net benefit associated with producing five units of the control variable, Q...
 What is the marginal net benefit associated with producing five
units of the control variable, Q (identify point F in the
table)?
Net Marginal Marginal Marginal Net Total variable | Benefits CostsBenefits Benefit c(Q) Contro.1 Total Cost Benefit B(Q) N(Q) MB(Q) MC (Q) MNB (Q) 800 600 400 200 100 900 800 700 600 500 800 100 300 600 1,000 1,500 2,100 2,800 900 1,700 2,400 200 2 1,800 2,000 2,000 1,800 1,400 800 400 500 600 700 800 900...
What is the marginal net benefit associated with producing five
units of the control variable, Q (identify point F in the
table)?
Net Marginal Marginal Marginal Net Total variable | Benefits CostsBenefits Benefit c(Q) Contro.1 Total Cost Benefit B(Q) N(Q) MB(Q) MC (Q) MNB (Q) 800 600 400 200 100 900 800 700 600 500 800 100 300 600 1,000 1,500 2,100 2,800 900 1,700 2,400 200 2 1,800 2,000 2,000 1,800 1,400 800 400 500 600 700 800 900...
Use Table Below: Coal Mine Pollution. The table shows the marginal social benefit and cost of...
 Use Table Below: Coal Mine Pollution. The table shows the
marginal social benefit and cost of various amounts of pollution
from a coal mine. If 5 tons of pollution is produced, the marginal
social benefit is _____, and the marginal social cost is
_____.
$400; $400
$300; $500
$0; $800
$800; $0
Table: Coal Mine Pollution Quantity of Marginal Marginal Pollution Social Social (tons) Benefit Cost $800 $0 700 100 600 200 500 300 400 500 200 600 700 0...
Use Table Below: Coal Mine Pollution. The table shows the
marginal social benefit and cost of various amounts of pollution
from a coal mine. If 5 tons of pollution is produced, the marginal
social benefit is _____, and the marginal social cost is
_____.
$400; $400
$300; $500
$0; $800
$800; $0
Table: Coal Mine Pollution Quantity of Marginal Marginal Pollution Social Social (tons) Benefit Cost $800 $0 700 100 600 200 500 300 400 500 200 600 700 0...
QUESTION 51 od Marginal benefit of individual polluter $1,000 900 Firma 800 700 600 Firm 500...
 QUESTION 51 od Marginal benefit of individual polluter $1,000 900 Firma 800 700 600 Firm 500 400 300 Firm 200 100 100 200 300 400 500 600 700 800 1.000 Quantity of mercury (tons) The figure above shows three different polluting firms. Let's assume the government imposes a $300 tax on each ton of emission. Based on that, how much pollution will Firm B have? O 200 0 O 500 Oo O 1,000
Marginal Cost Average Variable Cost Average Total Cost Quantity of Exercise Machines 1 2 3 4...
 Marginal Cost Average Variable Cost Average Total Cost Quantity of Exercise Machines 1 2 3 4 5 6 7 8 9 10 $200 $400 $600 $800 $1,000 $1,200 $1,400 $1,600 $1,800 $2,000 $200 $300 $400 $500 $600 $700 $800 $900 $1000 $1100 $1200 $800 $733.33 $750 $800 $866.67 $942.86 $1025 $1111.11 $1200 The above table shows the costs of a small manufacturer producing different quantities of exercise machines. If the exercise machine market is perfectly competitive and exercise machines cost...
Marginal Cost Quantity of Exercise Machines Average Variable Cost Average Total Cost 1 2 3 4...
 Marginal Cost Quantity of Exercise Machines Average Variable Cost Average Total Cost 1 2 3 4 5 6 7 8 9 10 $200 $400 $600 $800 $1,000 $1,200 $1,400 $1,600 $1,800 $2,000 $200 $300 $400 $500 $600 $700 $800 $900 $1000 $1100 $1200 $800 $733.33 $750 $800 $866.67 $942.86 $1025 $1111.11 $1200 The above table shows the costs of a small manufacturer producing different quantities of exercise machines. If the exercise machine market is perfectly competitive and exercise machines cost...
Table: Coal Mine Pollution Quantity of Pollution (tons) Marginal Social Benefit Marginal Social Cost 0 $800...
Table: Coal Mine Pollution Quantity of Pollution (tons) Marginal Social Benefit Marginal Social Cost 0 $800 $0 1 $700 $100 2 $600 $200 3 $500 $300 4 $400 $400 5 $300 $500 6 $200 $600 7 $100 $700 8 $0 $800 Reference: Ref 16-2 Table: Coal Mine Pollution (Table: Coal Mine Pollution) Use Table: Coal Mine Pollution. The table shows the marginal social benefit and cost of various amounts of pollution from a coal mine. If 2 tons of pollution...
The information shown in the graphs represents hypothetical production functions of two countries. Suppose in a...
 The information shown in the graphs represents hypothetical production functions of two countries. Suppose in a given year East Ablished moves from point A to point B on its production function, while Uneastablished moves from point C to point D on its production function East ablished Uneastablished 900 800 700 600 500 O 400 300 200 100 900 800 700 600 E 500 O 400 300 200 100 0 100 200 300 400 500 600 700 800 900 0 100...
Workers Output Marginal Product Fixed cost Variable cost Total Cost Average Total cost Marginal cost 0...
Workers Output Marginal Product Fixed cost Variable cost Total Cost Average Total cost Marginal cost 0 0 200 0 200 1 20 20 200 100 300 300 5.00 2 50 30 200 200 400 200 3.33 3 90 40 200 300 500 166.67 2.50 4 120 30 200 400 600 150 3.33 5 140 20 200 500 700 140 5.00 6 150 10 200 600 800 133.33 10.00 7 155 5 200 700 900 128.57 20.00 a. Fill in the...
Table 1.2 1 4 5 6 Average 2 3 Investment A 400 300 500 200 100...
 Table 1.2 1 4 5 6 Average 2 3 Investment A 400 300 500 200 100 - 300 After tax benefits Value of Investment Jan 1 Dec 31 Average 200 ---- 1000 800 900 800 600 700 600 400 500 400 2000 300 100 --- 500 1 4 5 6 Average 2 3 Investment B 200 300 100 400 500 600 350 After tax benefits Value of Investment Jan 1 Dec 31 1000 833 917 833 666 750 666 499...
Figure: City with Two Polluters Marginal benefit to individual producer $1,100 1,000MB 900 800 700 600...
 Figure: City with Two Polluters Marginal benefit to individual producer $1,100 1,000MB 900 800 700 600 500 MB 400 300 200 100 1,000 1,400 1,800 2,200 Quantity of pollution emissions (tons) 200 600 5. (Figure: City with Two Polluters) Look at the figure City with Two Polluters. If the govermment imposed an emissions tax of $400, firm A would produce produce A) 200; 400 B) 400; 1,200 C) 800; 1,400 D) 1,200; 1,600 , tons of emissions and firm B...
 What is the marginal net benefit associated with producing five
units of the control variable, Q (identify point F in the
table)?
Net Marginal Marginal Marginal Net Total variable | Benefits CostsBenefits Benefit c(Q) Contro.1 Total Cost Benefit B(Q) N(Q) MB(Q) MC (Q) MNB (Q) 800 600 400 200 100 900 800 700 600 500 800 100 300 600 1,000 1,500 2,100 2,800 900 1,700 2,400 200 2 1,800 2,000 2,000 1,800 1,400 800 400 500 600 700 800 900...
What is the marginal net benefit associated with producing five
units of the control variable, Q (identify point F in the
table)?
Net Marginal Marginal Marginal Net Total variable | Benefits CostsBenefits Benefit c(Q) Contro.1 Total Cost Benefit B(Q) N(Q) MB(Q) MC (Q) MNB (Q) 800 600 400 200 100 900 800 700 600 500 800 100 300 600 1,000 1,500 2,100 2,800 900 1,700 2,400 200 2 1,800 2,000 2,000 1,800 1,400 800 400 500 600 700 800 900...
 Use Table Below: Coal Mine Pollution. The table shows the
marginal social benefit and cost of various amounts of pollution
from a coal mine. If 5 tons of pollution is produced, the marginal
social benefit is _____, and the marginal social cost is
_____.
$400; $400
$300; $500
$0; $800
$800; $0
Table: Coal Mine Pollution Quantity of Marginal Marginal Pollution Social Social (tons) Benefit Cost $800 $0 700 100 600 200 500 300 400 500 200 600 700 0...
Use Table Below: Coal Mine Pollution. The table shows the
marginal social benefit and cost of various amounts of pollution
from a coal mine. If 5 tons of pollution is produced, the marginal
social benefit is _____, and the marginal social cost is
_____.
$400; $400
$300; $500
$0; $800
$800; $0
Table: Coal Mine Pollution Quantity of Marginal Marginal Pollution Social Social (tons) Benefit Cost $800 $0 700 100 600 200 500 300 400 500 200 600 700 0...
 QUESTION 51 od Marginal benefit of individual polluter $1,000 900 Firma 800 700 600 Firm 500 400 300 Firm 200 100 100 200 300 400 500 600 700 800 1.000 Quantity of mercury (tons) The figure above shows three different polluting firms. Let's assume the government imposes a $300 tax on each ton of emission. Based on that, how much pollution will Firm B have? O 200 0 O 500 Oo O 1,000
 Marginal Cost Average Variable Cost Average Total Cost Quantity of Exercise Machines 1 2 3 4 5 6 7 8 9 10 $200 $400 $600 $800 $1,000 $1,200 $1,400 $1,600 $1,800 $2,000 $200 $300 $400 $500 $600 $700 $800 $900 $1000 $1100 $1200 $800 $733.33 $750 $800 $866.67 $942.86 $1025 $1111.11 $1200 The above table shows the costs of a small manufacturer producing different quantities of exercise machines. If the exercise machine market is perfectly competitive and exercise machines cost...
 Marginal Cost Quantity of Exercise Machines Average Variable Cost Average Total Cost 1 2 3 4 5 6 7 8 9 10 $200 $400 $600 $800 $1,000 $1,200 $1,400 $1,600 $1,800 $2,000 $200 $300 $400 $500 $600 $700 $800 $900 $1000 $1100 $1200 $800 $733.33 $750 $800 $866.67 $942.86 $1025 $1111.11 $1200 The above table shows the costs of a small manufacturer producing different quantities of exercise machines. If the exercise machine market is perfectly competitive and exercise machines cost...
 The information shown in the graphs represents hypothetical production functions of two countries. Suppose in a given year East Ablished moves from point A to point B on its production function, while Uneastablished moves from point C to point D on its production function East ablished Uneastablished 900 800 700 600 500 O 400 300 200 100 900 800 700 600 E 500 O 400 300 200 100 0 100 200 300 400 500 600 700 800 900 0 100...
 Table 1.2 1 4 5 6 Average 2 3 Investment A 400 300 500 200 100 - 300 After tax benefits Value of Investment Jan 1 Dec 31 Average 200 ---- 1000 800 900 800 600 700 600 400 500 400 2000 300 100 --- 500 1 4 5 6 Average 2 3 Investment B 200 300 100 400 500 600 350 After tax benefits Value of Investment Jan 1 Dec 31 1000 833 917 833 666 750 666 499...
 Figure: City with Two Polluters Marginal benefit to individual producer $1,100 1,000MB 900 800 700 600 500 MB 400 300 200 100 1,000 1,400 1,800 2,200 Quantity of pollution emissions (tons) 200 600 5. (Figure: City with Two Polluters) Look at the figure City with Two Polluters. If the govermment imposed an emissions tax of $400, firm A would produce produce A) 200; 400 B) 400; 1,200 C) 800; 1,400 D) 1,200; 1,600 , tons of emissions and firm B...
Most questions answered within 3 hours.
-
part 1: Create Useful Functions.
Create the following functions in MATLAB and use the function
names...
asked 18 minutes ago -
Write a user-defined MATLAB function for the following math
function y(x). The input to the function...
asked 7 minutes ago -
(8Python Question!!!
Given the list of employees defined in the cell below,
process the list of...
asked 15 minutes ago -
You own a lottery ticket, which has a 1 percent chance (0.01) of
winning $1,000.
Someone...
asked 15 minutes ago -
Six different letters are to be put in six envelopes of
different colors in a manner...
asked 16 minutes ago -
Oil of relative density 0.8 flows at the rate of
216000m3/s through a falling pipe which...
asked 20 minutes ago -
Using H and T, describe the Event of getting at least one H in
the two...
asked 29 minutes ago -
Mean is 500, Standard Deviation is 80.
Question:
If 1,100 students had a score of 600...
asked 30 minutes ago -
Why are coenzymes necessary for chemical reactions?
Coenzymes are responsible for carrying substrates to the active...
asked 36 minutes ago -
4. Using the mks units (meters-kilograms-seconds), suppose you
have a spring with spring constant
4 N/m....
asked 49 minutes ago -
On July 9, Mifflin Company receives an $9,100, 120-day, 6% note
from customer Payton Summers as...
asked 45 minutes ago -
Sodium acetate gives potato chips a salt an vinegar flavor.
Which statement is true of a...
asked 50 minutes ago