
Homework Answers
Add Answer to:
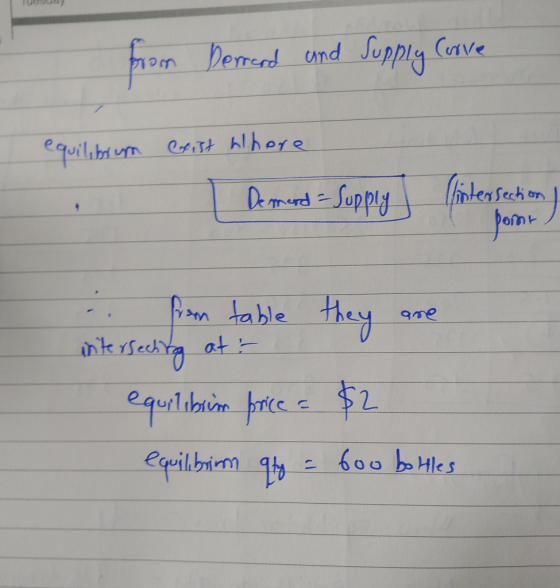
The graph below represents the market for bottled water. a. What is the equilibrium price? $...
The graph below represents the market for bottled water. b. If a price floor Is Imposed...
 The graph below represents the market for bottled water. b. If a price floor Is Imposed at $1.50 per bottle, how large will the surplus in the market be? bottles Do NOT press Enter after typing the answer in each cell. Use Tab or take the cursor to the next cell. Price (dollars ܪܵܝܼ ܝܼ ܝܼ ܊ ܝܼ ܝܼ ܝܼ ܝܼܐ - ; Submit 200 400 600 800 1,000 1,200 Quantity (bottles)
Suppose the quantity demanded increases by 150 tons at every price. Consider the market for strawberries...
 Suppose the quantity demanded increases by 150 tons at every price. Consider the market for strawberries represented in the schedule below. What is the new equilibrium price? $ What is the new equilibrium quantity? tons 275 Do NOT press Enter after typing the answer in each cell. Use Tab or take the cursor to the next cell. Price Quantity Supplied Quantity Demanded ($/b.) (tons) (tons) $3.00 125 2.50 250 175 2.00 225 225 1.50 200 275 1.00 175 325 0.50...
The following table shows the supply and demand schedules for computers in Sweden and Norway. Price...
The following table shows the supply and demand schedules for computers in Sweden and Norway. Price Sweden Price Norway (Dollars) Quantity Supplied Quantity Demanded (Dollars) Quantity Supplied Quantity Demanded 0 0 1,200 0 1,800 5 200 1,000 5 1,600 10 400 800 10 1,400 15 600 600 15 0 1,200 20 800 400 20 200 1,000 25 1,000 200 25 400 800 30 1,200 0 30 600 600 35 1,400 35 800 400 40 1,600 40 1,000 200 45 1,800...
9. Shifts in supply or demand II The following graph shows the market for...
 1)9. Shifts in supply or demand IIThe following graph shows the market for cakes in Miami, where there are over 1,000 bakeries at any given moment. Suppose the price of flour, a major ingredient in cakes, suddenly increases.Show the effect of this change on the market for cakes by shifting one or both of the curves on the following graph, holding all else constant.2)10. Market equilibriumThe following table shows the annual demand and supply in the market for shoes in...
#1. The following table illustrates the demand and supply schedules for calculators in Sweden and Norway...
 #1. The following table illustrates the demand and supply schedules for calculators in Sweden and Norway (measured in dollars). Price Sweden Norway Quantity Supplied Quantity Demanded | Quantity Supplied Quantity Demanded 0 1,200 1,800 200 1,000 - 1,600 400 800 1.400 600 600 1,200 800 400 200 1,000 1,000 200 400 800 1,200 600 600 1,400 800 400 1,600 1,000 200 1,800 1,200 a. In a similar graph to Figure 3.6(a) - page 106- of the Carbaugh text, draw the...
12. Suppose Market A (left) represents the market for corn in the short run and Market...
 12. Suppose Market A (left) represents the market for corn in the short run and Market B represents the market for corn (right) in the long run. Large scale negative publicity about the health effects of high fructose corn syrup would have a larger effect on the price of corn in which market? Assume that the effect of negative publicity is the same in both the short and the long run. X 50 50 40 40 MC 30 30 20...
The following graph shows the daily market for wine when a tax on sellers is set...
 The following graph shows the daily market for wine when a tax on sellers is set at $0 per bottle. Suppose the government institutes a tax of $40.60 per bottle, to be paid by the seller. (Hint: To see the impact of the tax, enter the value of the tax in the Tax on Sellers field and move the green line to the after-tax equilibrium by adjusting the value in the Quantity field. Then enter zero in the Tax on...
3. Market equilibrium The following table shows the annual demand and supply in the market for...
 3. Market equilibrium The following table shows the annual demand and supply in the market for shorts in Detroit. Price Quantity Demanded (Pairs of shorts) Quantity Supplied (Pairs of shorts) (Dollars per pair of shorts) 6 1,100 200 12 800 500 18 400 700 24 200 900 30 100 1,000 On the following graph, plot the demand for shorts using the blue point (circle symbol). Next, plot the supply of shorts using the orange point (square symbol). Finally, use the...
The data below represents the price level, the aggregate demand, and the aggregate supply data for...
 The data below represents the price level, the aggregate demand, and the aggregate supply data for an economy. Use the data points to plot an aggregate demand curve and aggregate supply curve for this economy. Each curve is labeled as AS (Aggregate Supply) or AD (Aggregate Demand) and each point is labeled as a, b, or c from the table headings. 60 Price Level Aggregate Supply (AS) Aggregate Demand (AD) 20 $800 $1,400 $1,000 $1,000 100 $1,200 $600 Provide your...
1.12 The following graph represents the market for wheat. The equilibrium price is $20 per bushel...
 1.12 The following graph represents the market for wheat. The equilibrium price is $20 per bushel and the equilibrium quantity is 14 million bushels. Price of wheat (bushel) Supply 30 20 10 Demand 0 2 4 6 8 10 12 14 16 18 20 22 24 26 Quantity of wheat (millions of bushels) yEconLab Visit www.myeconlab.com to complete feedback. Exercises that update with real- supply and demand curve *5.9 Suppose the market demand for pizza is given by Qu 300...
 The graph below represents the market for bottled water. b. If a price floor Is Imposed at $1.50 per bottle, how large will the surplus in the market be? bottles Do NOT press Enter after typing the answer in each cell. Use Tab or take the cursor to the next cell. Price (dollars ܪܵܝܼ ܝܼ ܝܼ ܊ ܝܼ ܝܼ ܝܼ ܝܼܐ - ; Submit 200 400 600 800 1,000 1,200 Quantity (bottles)
 Suppose the quantity demanded increases by 150 tons at every price. Consider the market for strawberries represented in the schedule below. What is the new equilibrium price? $ What is the new equilibrium quantity? tons 275 Do NOT press Enter after typing the answer in each cell. Use Tab or take the cursor to the next cell. Price Quantity Supplied Quantity Demanded ($/b.) (tons) (tons) $3.00 125 2.50 250 175 2.00 225 225 1.50 200 275 1.00 175 325 0.50...
 #1. The following table illustrates the demand and supply schedules for calculators in Sweden and Norway (measured in dollars). Price Sweden Norway Quantity Supplied Quantity Demanded | Quantity Supplied Quantity Demanded 0 1,200 1,800 200 1,000 - 1,600 400 800 1.400 600 600 1,200 800 400 200 1,000 1,000 200 400 800 1,200 600 600 1,400 800 400 1,600 1,000 200 1,800 1,200 a. In a similar graph to Figure 3.6(a) - page 106- of the Carbaugh text, draw the...
 12. Suppose Market A (left) represents the market for corn in the short run and Market B represents the market for corn (right) in the long run. Large scale negative publicity about the health effects of high fructose corn syrup would have a larger effect on the price of corn in which market? Assume that the effect of negative publicity is the same in both the short and the long run. X 50 50 40 40 MC 30 30 20...
 The following graph shows the daily market for wine when a tax on sellers is set at $0 per bottle. Suppose the government institutes a tax of $40.60 per bottle, to be paid by the seller. (Hint: To see the impact of the tax, enter the value of the tax in the Tax on Sellers field and move the green line to the after-tax equilibrium by adjusting the value in the Quantity field. Then enter zero in the Tax on...
 3. Market equilibrium The following table shows the annual demand and supply in the market for shorts in Detroit. Price Quantity Demanded (Pairs of shorts) Quantity Supplied (Pairs of shorts) (Dollars per pair of shorts) 6 1,100 200 12 800 500 18 400 700 24 200 900 30 100 1,000 On the following graph, plot the demand for shorts using the blue point (circle symbol). Next, plot the supply of shorts using the orange point (square symbol). Finally, use the...
 The data below represents the price level, the aggregate demand, and the aggregate supply data for an economy. Use the data points to plot an aggregate demand curve and aggregate supply curve for this economy. Each curve is labeled as AS (Aggregate Supply) or AD (Aggregate Demand) and each point is labeled as a, b, or c from the table headings. 60 Price Level Aggregate Supply (AS) Aggregate Demand (AD) 20 $800 $1,400 $1,000 $1,000 100 $1,200 $600 Provide your...
 1.12 The following graph represents the market for wheat. The equilibrium price is $20 per bushel and the equilibrium quantity is 14 million bushels. Price of wheat (bushel) Supply 30 20 10 Demand 0 2 4 6 8 10 12 14 16 18 20 22 24 26 Quantity of wheat (millions of bushels) yEconLab Visit www.myeconlab.com to complete feedback. Exercises that update with real- supply and demand curve *5.9 Suppose the market demand for pizza is given by Qu 300...
Most questions answered within 3 hours.
-
How can we identify what the horizontal force is when looking at
a merry go round?...
asked 21 minutes ago -
While Dime Community Bank is based in Brooklyn; management has
decided to focus its lending activity...
asked 46 minutes ago -
1) Earnings functions, whereby the log of earnings is regressed
on years of education, years of...
asked 20 minutes ago -
Bruno Corporation is involved in the business of injection
molding of plastics. It is considering the...
asked 25 minutes ago -
What would be the vapor pressure of water at 96°C above a
solution made by dissolving...
asked 40 minutes ago -
Hydration of norbornene
Write the reaction. Discuss the intermediate. Explain how the
equilibrium in the reaction...
asked 48 minutes ago -
Suppose that a party wanted to enter an FRA that expires in 42
days and is...
asked 48 minutes ago -
ABC Ltd. estimated that a new store requires an initial
investment of $800,000. This new store...
asked 49 minutes ago -
1. Review the Nike’s marketing strategy. You must include the
company’s target market, possible market segmentation,...
asked 1 hour ago -
One of the major advantages of ______________ is to enhance
security for private networks by keeping...
asked 1 hour ago -
Book:
Title: Framework for
Marketing Management, 15th edition
Author/s: Philip T.
Kotler, Kevin Lane Keller
1....
asked 1 hour ago -
Given Uber’s recent corporate turbulence and ongoing
initiatives, provide a holistic situational analysis of the
environment...
asked 1 hour ago