


Homework Answers
Answer 1.
1. Perfectly competitive firm produces where P=MC= $11
When Q=100, P=MC=$11.
2. When P=$11, ATC=$9, Q=100
Profit= (P-ATC)*Q= (11-9)*100=$200
3. profit is the rectangular area below the P above ATC, till Q.
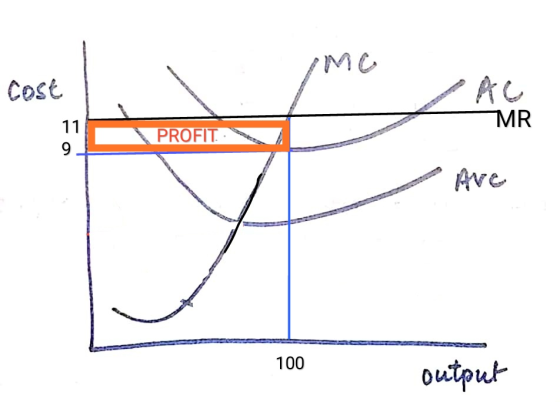
4. AFC=ATC-AVC= $9-$6=$3
Total fixed cost= AFC*Q=$3*100=$300
Total fixed cost=$300
5. When the firm shuts down, the variable cost are zero. So the total loss is of fixed cost as they have already been incurred.
In this case, loss= TFC=$300
Note-According to HOMEWORKLIB RULES first question can be answered.
Add Answer to:
8:52 Blackboard Question 1 (10 Marks) The following graph represents the situation of Sinda competitive caps...
1) How much output should Sindbad produce to maximize his profit, if the market price is...
 1) How much output should
Sindbad produce to maximize his profit, if the market price is
equal
to $11? (2 marks)
2) How much profit (loss) will he earn? (2 marks)
3) Indicate the profit (loss) area on the graph. (2 marks)
4) Find the fixed cost paid by the firm. (2 marks)
5) Suppose Sindbad decides to shut down. What would his loss be? (2
marks)
The following graph represents the situation of Sindbad's caps, a firm selling caps...
1) How much output should
Sindbad produce to maximize his profit, if the market price is
equal
to $11? (2 marks)
2) How much profit (loss) will he earn? (2 marks)
3) Indicate the profit (loss) area on the graph. (2 marks)
4) Find the fixed cost paid by the firm. (2 marks)
5) Suppose Sindbad decides to shut down. What would his loss be? (2
marks)
The following graph represents the situation of Sindbad's caps, a firm selling caps...
V OIVERSITY 2. Consider the following graph (10 marks) ATC NER Q1 Q2 Q3 Q4 The...
 V OIVERSITY 2. Consider the following graph (10 marks) ATC NER Q1 Q2 Q3 Q4 The graph above shows the demand curve (D), marginal cost curve (MC), average cost curve (AC), and marginal revenue curve (MR) for a monopolist. a) What is the profit maximizing quantity and price for the monopolist? Answer: b) If this is a perfectly competitive market, what is the equilibrium quantity and price? Answer: c) What area represents the deadweight loss caused by the monopolist? Answer:
2. Consider the following exph (10 marks) Zoom ATC Ne The graph above shows the demand...
 2. Consider the following exph (10 marks) Zoom ATC Ne The graph above shows the demand curve (D), marginal cost curve (MC), average cout exurve (AC), and marginal revenue curve (MR) for a monopolist. a) What is the profit maximizing quantity and price for the monopolist? Answer b) If this is a perfectly competitive market, what is the equilibrium quantity and price? Answer: c) What area represents the deadweight loss caused by the monopolist? Answer:
Please explain in details with step by step solution, Thank you very much ) Assume a...
 Please explain in details with step by step solution, Thank you
very much
) Assume a monopolist faces a market demand curve P 100 - 2Q and has the short-run total cost function C 640+20Q. i) What is the profit-maximizing level of output? What is the profits? Graph the marginal revenue, marginal cost, and demand curves, and show the area that (7 Marks) In Question f (i), what would price and output be if the firm priced at socially represents...
Please explain in details with step by step solution, Thank you
very much
) Assume a monopolist faces a market demand curve P 100 - 2Q and has the short-run total cost function C 640+20Q. i) What is the profit-maximizing level of output? What is the profits? Graph the marginal revenue, marginal cost, and demand curves, and show the area that (7 Marks) In Question f (i), what would price and output be if the firm priced at socially represents...
1. Let the market demand curve be P=1000 - 10Q. Assume the market is controlled by...
1. Let the market demand curve be P=1000 - 10Q. Assume the market is controlled by a monopolist. Let fixed cost be $10,000 and Marginal Costs (MC)=20Q. a) What is the profit maximizing output? b) What is the monopolist's total revenue at the profit maximizing output? c) How much profit is the monopolist earning? d) Assume the government breaks up the monopolist in order to create a perfectly competitive market of identical firms. Assume the MC curve is now the...
We were unable to transcribe this imageNow, assume that one of the hot dog stands successfully lobbies the city council to obtain the exclusive right to sell hot dogs within the city limits. This fir...
 We were unable to transcribe this imageNow, assume that one of the hot dog stands successfully lobbies the city council to obtain the exclusive right to sell hot dogs within the city limits. This firm buys up all the rest of the hot dog stands in the city and operates as a monopoly. Assume that this change doesn't affect demand and that the new monopoly's marginal cost curve corresponds exactly to the supply curve on the previous graph. Under this...
Suppose a monopolist faces the following demand curve: P = 440 – 7Q. The long run marginal cost of production is constant and equal to $20, and there are no fixed costs. A) What is the monopolist’s...
Suppose a monopolist faces the following demand curve: P = 440 – 7Q. The long run marginal cost of production is constant and equal to $20, and there are no fixed costs. A) What is the monopolist’s profit maximizing level of output? B) What price will the profit maximizing monopolist produce? C) How much profit will the monopolist make if she maximizes her profit? D) What would be the value of consumer surplus if the market were perfectly competitive? E)...
Suppose a profit maximizing monopolist has total cost and marginal cost as follow:
 Suppose a profit maximizing monopolist has total cost and marginal
cost as follow:1. Suppose a profit-maximizing monopolist has total cost and marginal cost as follow: \(\mathrm{TC}=0.1 Q^{2}+Q+10\) and \(\mathrm{MC}=0.2 Q+1\). It faces the demand curve \(\mathrm{Q}=35-5^{\mathrm{P}} .(35\) points \()\)a) What are the price, output, and profit for this monopolist?b) Carefully draw the diagram that illustrates your answers.c) What are the equilibrium price, output, and total profit if this is a perfectly competitive market?d) Compare the results between monopoly and perfect...
Suppose a profit maximizing monopolist has total cost and marginal
cost as follow:1. Suppose a profit-maximizing monopolist has total cost and marginal cost as follow: \(\mathrm{TC}=0.1 Q^{2}+Q+10\) and \(\mathrm{MC}=0.2 Q+1\). It faces the demand curve \(\mathrm{Q}=35-5^{\mathrm{P}} .(35\) points \()\)a) What are the price, output, and profit for this monopolist?b) Carefully draw the diagram that illustrates your answers.c) What are the equilibrium price, output, and total profit if this is a perfectly competitive market?d) Compare the results between monopoly and perfect...
15. Use the following figure for a firm in a perfectly competitive market. a What is the output that maximizes...
 15. Use the following figure for a firm in a perfectly competitive market. a What is the output that maximizes the firm's profit? b. At the profit-maximizing output, calculate total revenue and total cost. C. If the firm maximizes profit, how much profit does it earn? d. What will likely happen to market demand or market supply in the long run? e. What will likely happen to the market price in the long run? Price (s) d = P =...
Consider an industry that is competitive with N firms and has the following market demand and...
 Consider an industry that is competitive with N firms and has the following market demand and supply. To start with, suppose there is no other relevant fact or issue at play. Thus, the market D and S looks as in this graph, Figure 1. a) Depict such a graph on your paper and indicate the following: Market price and output, the socially optimal output, the size of consumer surplus, and the size of producer surplus. b) Now, suppose that overnight...
 1) How much output should
Sindbad produce to maximize his profit, if the market price is
equal
to $11? (2 marks)
2) How much profit (loss) will he earn? (2 marks)
3) Indicate the profit (loss) area on the graph. (2 marks)
4) Find the fixed cost paid by the firm. (2 marks)
5) Suppose Sindbad decides to shut down. What would his loss be? (2
marks)
The following graph represents the situation of Sindbad's caps, a firm selling caps...
1) How much output should
Sindbad produce to maximize his profit, if the market price is
equal
to $11? (2 marks)
2) How much profit (loss) will he earn? (2 marks)
3) Indicate the profit (loss) area on the graph. (2 marks)
4) Find the fixed cost paid by the firm. (2 marks)
5) Suppose Sindbad decides to shut down. What would his loss be? (2
marks)
The following graph represents the situation of Sindbad's caps, a firm selling caps...
 V OIVERSITY 2. Consider the following graph (10 marks) ATC NER Q1 Q2 Q3 Q4 The graph above shows the demand curve (D), marginal cost curve (MC), average cost curve (AC), and marginal revenue curve (MR) for a monopolist. a) What is the profit maximizing quantity and price for the monopolist? Answer: b) If this is a perfectly competitive market, what is the equilibrium quantity and price? Answer: c) What area represents the deadweight loss caused by the monopolist? Answer:
 2. Consider the following exph (10 marks) Zoom ATC Ne The graph above shows the demand curve (D), marginal cost curve (MC), average cout exurve (AC), and marginal revenue curve (MR) for a monopolist. a) What is the profit maximizing quantity and price for the monopolist? Answer b) If this is a perfectly competitive market, what is the equilibrium quantity and price? Answer: c) What area represents the deadweight loss caused by the monopolist? Answer:
 Please explain in details with step by step solution, Thank you
very much
) Assume a monopolist faces a market demand curve P 100 - 2Q and has the short-run total cost function C 640+20Q. i) What is the profit-maximizing level of output? What is the profits? Graph the marginal revenue, marginal cost, and demand curves, and show the area that (7 Marks) In Question f (i), what would price and output be if the firm priced at socially represents...
Please explain in details with step by step solution, Thank you
very much
) Assume a monopolist faces a market demand curve P 100 - 2Q and has the short-run total cost function C 640+20Q. i) What is the profit-maximizing level of output? What is the profits? Graph the marginal revenue, marginal cost, and demand curves, and show the area that (7 Marks) In Question f (i), what would price and output be if the firm priced at socially represents...
 We were unable to transcribe this imageNow, assume that one of the hot dog stands successfully lobbies the city council to obtain the exclusive right to sell hot dogs within the city limits. This firm buys up all the rest of the hot dog stands in the city and operates as a monopoly. Assume that this change doesn't affect demand and that the new monopoly's marginal cost curve corresponds exactly to the supply curve on the previous graph. Under this...
 Suppose a profit maximizing monopolist has total cost and marginal
cost as follow:1. Suppose a profit-maximizing monopolist has total cost and marginal cost as follow: \(\mathrm{TC}=0.1 Q^{2}+Q+10\) and \(\mathrm{MC}=0.2 Q+1\). It faces the demand curve \(\mathrm{Q}=35-5^{\mathrm{P}} .(35\) points \()\)a) What are the price, output, and profit for this monopolist?b) Carefully draw the diagram that illustrates your answers.c) What are the equilibrium price, output, and total profit if this is a perfectly competitive market?d) Compare the results between monopoly and perfect...
Suppose a profit maximizing monopolist has total cost and marginal
cost as follow:1. Suppose a profit-maximizing monopolist has total cost and marginal cost as follow: \(\mathrm{TC}=0.1 Q^{2}+Q+10\) and \(\mathrm{MC}=0.2 Q+1\). It faces the demand curve \(\mathrm{Q}=35-5^{\mathrm{P}} .(35\) points \()\)a) What are the price, output, and profit for this monopolist?b) Carefully draw the diagram that illustrates your answers.c) What are the equilibrium price, output, and total profit if this is a perfectly competitive market?d) Compare the results between monopoly and perfect...
 15. Use the following figure for a firm in a perfectly competitive market. a What is the output that maximizes the firm's profit? b. At the profit-maximizing output, calculate total revenue and total cost. C. If the firm maximizes profit, how much profit does it earn? d. What will likely happen to market demand or market supply in the long run? e. What will likely happen to the market price in the long run? Price (s) d = P =...
 Consider an industry that is competitive with N firms and has the following market demand and supply. To start with, suppose there is no other relevant fact or issue at play. Thus, the market D and S looks as in this graph, Figure 1. a) Depict such a graph on your paper and indicate the following: Market price and output, the socially optimal output, the size of consumer surplus, and the size of producer surplus. b) Now, suppose that overnight...
Most questions answered within 3 hours.
-
By using Arduino write a code that connects two LEDs to two
push-buttons. Each button controls...
asked 1 minute ago -
Bank of America has bonds that pay a coupon interest rate of 5.5
percent and mature...
asked 48 minutes ago -
Problem: Patient Fees C++
You are to write a program that computes a patient’s bill for...
asked 2 hours ago -
In a population of interest, we know that, 77% drink coffee, and
23% drink tea. Assume...
asked 2 hours ago -
Given that f(x) = e-(x-1) for x > 1, determine the following
probabilities:
a) P(X <...
asked 2 hours ago -
A mechanic pushes a 2.60 ✕ 103-kg car from rest to a speed of v,
doing...
asked 2 hours ago -
International information systems result in all of the following
except:
A. improved quality of information flow....
asked 2 hours ago -
The president of the retailer Prime Products has just approached
the company’s bank with a request...
asked 2 hours ago -
If the carrying amount is $200,000 and recoverable amount is
$205000, the impairment amount is:
Select...
asked 2 hours ago -
The correlation is inappropriate as a measure of association
between two quantitative variables (you may select...
asked 2 hours ago -
USE THE DATA IN THE TABLE BELOW TO ANSWER QUESTIONS 19 – 24
(Assume all account...
asked 2 hours ago -
Mahaley, Inc., manufactures and sells two products: Product Q9
and Product F0. Data concerning the expected...
asked 3 hours ago