Hello,
I need help answering these questions below for the Coke (KO) Company with the key ratios attached.
· How liquid is the company?
· Is management generating a substantial profit on the company's assets?
· If the management of the company would like to improve the company's financial performance, what should the management of THE COMPANY do?
Also, what specific recommendation with supporting rationale
would you recommend. as to whether the assigned company's recent
trends and results in financial performance is of sufficient
financial strength, will THE COMPANY be financially sustainable
over the next two to three years, and which steps should be done to
improve its financial stability?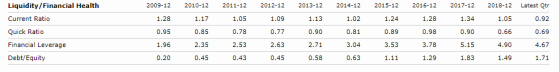


Homework Answers
Add Answer to:
Hello,
I need help answering these questions below for the Coke (KO)
Company with the key...
I need assistance answering the following questions based on the Coca Cola's Debt-To-Equity, Interest Coverage, and...
 I need assistance answering the following questions based on the
Coca Cola's Debt-To-Equity, Interest Coverage, and
Debt-To-Total-Asset ratios attached from the last 5 years which i
highlighted. Thanks in advance...
How is Coca Cola financing its assets? How much risk is
associated with the bonds issued by the company? How can this risk
be measured? Please explain.
Profitability TTM Tax Rate % Net Margin % 2009-12 22.80 22.02 0.69 15.30 1.96 30.15 20.79 26.20 Asset Turnover (Average) Return on Assets...
I need assistance answering the following questions based on the
Coca Cola's Debt-To-Equity, Interest Coverage, and
Debt-To-Total-Asset ratios attached from the last 5 years which i
highlighted. Thanks in advance...
How is Coca Cola financing its assets? How much risk is
associated with the bonds issued by the company? How can this risk
be measured? Please explain.
Profitability TTM Tax Rate % Net Margin % 2009-12 22.80 22.02 0.69 15.30 1.96 30.15 20.79 26.20 Asset Turnover (Average) Return on Assets...
I provided the EPS for the last 11 years. You only need to use the most...
 I provided the EPS for the last 11 years. You only need to use
the most recent 5 years. 2014-2018 to create the bar graph and
table.
b. Earnings per Share (EPS or "bottom line") trend over five years i. Provide a table ii. Provide a bar graph (also, as above, there is extra credit for including the logarithmic growth trend line graph too**) iii. What does the trend suggest (as above)? Tesla Annual EPS 2018 $-5.72 2017 $-11.83 2016...
I provided the EPS for the last 11 years. You only need to use
the most recent 5 years. 2014-2018 to create the bar graph and
table.
b. Earnings per Share (EPS or "bottom line") trend over five years i. Provide a table ii. Provide a bar graph (also, as above, there is extra credit for including the logarithmic growth trend line graph too**) iii. What does the trend suggest (as above)? Tesla Annual EPS 2018 $-5.72 2017 $-11.83 2016...
Please solve this question I want to solve this question on the attached tables Analyzing a...
 Please solve this question
I want to solve this question on the attached
tables
Analyzing a company for Its Investment Potential In its annual report, WRS Athletic Supply, Inc., includes the following five-year financial summary. WRS ATHLETIC SUPPLY, INC. Five-Year Financial Summary (Partial; adapted) 2010 2015 5244,524 2011 5137634 17% 2014 2013 2012 5217799 $191,329 5165,013 16% 20% 6% 5% 1,873 1,787 1,615 171,562 150,255 129,664 9% 2,001 191,838 1.191 108,725 41,236 36,356 31.679 27.408 22,516 1,383 (188) 1,063 (138)...
Please solve this question
I want to solve this question on the attached
tables
Analyzing a company for Its Investment Potential In its annual report, WRS Athletic Supply, Inc., includes the following five-year financial summary. WRS ATHLETIC SUPPLY, INC. Five-Year Financial Summary (Partial; adapted) 2010 2015 5244,524 2011 5137634 17% 2014 2013 2012 5217799 $191,329 5165,013 16% 20% 6% 5% 1,873 1,787 1,615 171,562 150,255 129,664 9% 2,001 191,838 1.191 108,725 41,236 36,356 31.679 27.408 22,516 1,383 (188) 1,063 (138)...
i answer most this budget but please complete it with explain the slove .. and analyse...
 i
answer most this budget but please complete it with explain the
slove .. and analyse it
the last photo is a clear slove
Analyzing a Company for its Investment Potential In its annual report, WRS Athletic Supply, Inc., includes the following five-year financial summary. WRS ATHLETIC SUPPLY, INC. Five-Year Financial Summary (Partial adapted) 2010 2011 $137,634 17% 2014 2013 2012 5344,524 5217599 $191,129 $165,013 16% 20% 5% 6% 1,873 1,78 1,615 191,838 171,562 150,235 129,664 96 5% 2,001 1,391...
i
answer most this budget but please complete it with explain the
slove .. and analyse it
the last photo is a clear slove
Analyzing a Company for its Investment Potential In its annual report, WRS Athletic Supply, Inc., includes the following five-year financial summary. WRS ATHLETIC SUPPLY, INC. Five-Year Financial Summary (Partial adapted) 2010 2011 $137,634 17% 2014 2013 2012 5344,524 5217599 $191,129 $165,013 16% 20% 5% 6% 1,873 1,78 1,615 191,838 171,562 150,235 129,664 96 5% 2,001 1,391...
pleas write clear and explain Analyzing a Company for its Investment Potential In its annual report,...
 pleas write clear
and explain
Analyzing a Company for its Investment Potential In its annual report, WRS Athletic Supply, Inc., includes the followin five-year financial summary. 2010 5% 2,001) 2011 5137534 17% 9% 1,391 108,725 WRS ATHLETIC SUPPLY, INC. Five-Year Financial Summary (Partial; adapted) (Dollar amounts in thousands except per share data 2015 2014 Net sales 2013 2012 5244,524 5217799 $191,329 5165,013 Net sales increase 12% 14% 16% 20% Domestic comparative store sales increase 8% Other income-net 1,873 1.787 1,615...
pleas write clear
and explain
Analyzing a Company for its Investment Potential In its annual report, WRS Athletic Supply, Inc., includes the followin five-year financial summary. 2010 5% 2,001) 2011 5137534 17% 9% 1,391 108,725 WRS ATHLETIC SUPPLY, INC. Five-Year Financial Summary (Partial; adapted) (Dollar amounts in thousands except per share data 2015 2014 Net sales 2013 2012 5244,524 5217799 $191,329 5165,013 Net sales increase 12% 14% 16% 20% Domestic comparative store sales increase 8% Other income-net 1,873 1.787 1,615...
The table below shows the annual returns from the U.S. stock market (RM) and from company...
The table below shows the annual returns from the U.S. stock market (RM) and from company XYZ's stocks (RXYZ) in the past seven years. Year RM RXYZ 2010 15% 12% 2011 2% 55% 2012 16% 4% 2013 32% 6% 2014 14% 9% 2015 1% -13% 2016 12% 61% What is the market risk, measure as beta, of Company XYZ? Note: Use a financial calculator to find beta. Do not use the rise-over-run approach. Keep 4 decimal places. For example, if...
I need help with problem 5.5 to solve for the 2016 ratios and to identify problems with the company and what the causes...
 I need help with problem 5.5
to solve for the 2016 ratios and to identify problems with the
company and what the causes may be
250 CHAPTER 5 The Analysis of Financial Statements STUDY QUESTIONS AND PROBLEMS 5.1. Explain how the credit analyst's focus will differ from the investment analyst's focus. 5.2. What are the limitations of financial ratios? 5.3. What do liquidity ratios measure? Activity ratios? Leverage ratios? Profitability ratios? Market ratios? 5.4. How is the Du Pont System...
I need help with problem 5.5
to solve for the 2016 ratios and to identify problems with the
company and what the causes may be
250 CHAPTER 5 The Analysis of Financial Statements STUDY QUESTIONS AND PROBLEMS 5.1. Explain how the credit analyst's focus will differ from the investment analyst's focus. 5.2. What are the limitations of financial ratios? 5.3. What do liquidity ratios measure? Activity ratios? Leverage ratios? Profitability ratios? Market ratios? 5.4. How is the Du Pont System...
I need help filling in the green spaces for both the Income Statement and Balance Sheet....
 I need help filling in the green spaces for both the Income
Statement and Balance Sheet. Below is Exhibit 1 (Financial and
Operating Data for Cosco).
TIP: use n = 3 for the CAGR calculation.
Please explain using an Excel spreadsheet,
formulas, and a step-by-step analysis/explanation.
Any
help would be appreciated!
EXHIBIT 1
Please use these financial ratio equations:
Liquity Ratios:
544 53 EXHIBIT 1 Selected Financial and Operating Data for Costco Wholesale Corp., Fiscal Years 2000, 2005, 2011, and...
I need help filling in the green spaces for both the Income
Statement and Balance Sheet. Below is Exhibit 1 (Financial and
Operating Data for Cosco).
TIP: use n = 3 for the CAGR calculation.
Please explain using an Excel spreadsheet,
formulas, and a step-by-step analysis/explanation.
Any
help would be appreciated!
EXHIBIT 1
Please use these financial ratio equations:
Liquity Ratios:
544 53 EXHIBIT 1 Selected Financial and Operating Data for Costco Wholesale Corp., Fiscal Years 2000, 2005, 2011, and...
Just see the data tiger prawn ignore another, please i really need your help ??? (g)...
 Just see the data tiger prawn ignore another, please i really
need your help ???
(g) Mangrove forests in the coastal areas are diminishing (X-axis) and the price of marine fish. (5 marks) (h) Increase in illegal and unreported fishing (X-axis) and fish population in the seas. (5 marks) (b) Given demand for the above individual fish or prawn species is 1,500 tons per annum for year 1996, and also assume demand growth solely depends on population growth at 3%...
Just see the data tiger prawn ignore another, please i really
need your help ???
(g) Mangrove forests in the coastal areas are diminishing (X-axis) and the price of marine fish. (5 marks) (h) Increase in illegal and unreported fishing (X-axis) and fish population in the seas. (5 marks) (b) Given demand for the above individual fish or prawn species is 1,500 tons per annum for year 1996, and also assume demand growth solely depends on population growth at 3%...
Please solve this question Analyzing a Company for Its Investment Potential In its annual report, WRS...
 Please solve this question
Analyzing a Company for Its Investment Potential In its annual report, WRS Athletic Supply, Inc., includes the following five-year financial summary. WRS ATHLETIC SUPPLY, INC. Five-Year Financial Summary (Partial; adapted) 2010 2015 5244,524 12% 2013 2012 $191,329 5165,013 16% 2011 $137,634 17% 2014 $217,799 14% 6% 1,873 171,562 16% 5% 20% 8% 2,001 191,838 1,787 150,255 1,615 129,664 1,391 108,725 41,236 36,356 31,679 27,408 22,516 1,063 (138) 4,487 8,039 1357 (171) 3,897 6,671 1,383 (188) 3,692...
Please solve this question
Analyzing a Company for Its Investment Potential In its annual report, WRS Athletic Supply, Inc., includes the following five-year financial summary. WRS ATHLETIC SUPPLY, INC. Five-Year Financial Summary (Partial; adapted) 2010 2015 5244,524 12% 2013 2012 $191,329 5165,013 16% 2011 $137,634 17% 2014 $217,799 14% 6% 1,873 171,562 16% 5% 20% 8% 2,001 191,838 1,787 150,255 1,615 129,664 1,391 108,725 41,236 36,356 31,679 27,408 22,516 1,063 (138) 4,487 8,039 1357 (171) 3,897 6,671 1,383 (188) 3,692...
 I need assistance answering the following questions based on the
Coca Cola's Debt-To-Equity, Interest Coverage, and
Debt-To-Total-Asset ratios attached from the last 5 years which i
highlighted. Thanks in advance...
How is Coca Cola financing its assets? How much risk is
associated with the bonds issued by the company? How can this risk
be measured? Please explain.
Profitability TTM Tax Rate % Net Margin % 2009-12 22.80 22.02 0.69 15.30 1.96 30.15 20.79 26.20 Asset Turnover (Average) Return on Assets...
I need assistance answering the following questions based on the
Coca Cola's Debt-To-Equity, Interest Coverage, and
Debt-To-Total-Asset ratios attached from the last 5 years which i
highlighted. Thanks in advance...
How is Coca Cola financing its assets? How much risk is
associated with the bonds issued by the company? How can this risk
be measured? Please explain.
Profitability TTM Tax Rate % Net Margin % 2009-12 22.80 22.02 0.69 15.30 1.96 30.15 20.79 26.20 Asset Turnover (Average) Return on Assets...
 I provided the EPS for the last 11 years. You only need to use
the most recent 5 years. 2014-2018 to create the bar graph and
table.
b. Earnings per Share (EPS or "bottom line") trend over five years i. Provide a table ii. Provide a bar graph (also, as above, there is extra credit for including the logarithmic growth trend line graph too**) iii. What does the trend suggest (as above)? Tesla Annual EPS 2018 $-5.72 2017 $-11.83 2016...
I provided the EPS for the last 11 years. You only need to use
the most recent 5 years. 2014-2018 to create the bar graph and
table.
b. Earnings per Share (EPS or "bottom line") trend over five years i. Provide a table ii. Provide a bar graph (also, as above, there is extra credit for including the logarithmic growth trend line graph too**) iii. What does the trend suggest (as above)? Tesla Annual EPS 2018 $-5.72 2017 $-11.83 2016...
 Please solve this question
I want to solve this question on the attached
tables
Analyzing a company for Its Investment Potential In its annual report, WRS Athletic Supply, Inc., includes the following five-year financial summary. WRS ATHLETIC SUPPLY, INC. Five-Year Financial Summary (Partial; adapted) 2010 2015 5244,524 2011 5137634 17% 2014 2013 2012 5217799 $191,329 5165,013 16% 20% 6% 5% 1,873 1,787 1,615 171,562 150,255 129,664 9% 2,001 191,838 1.191 108,725 41,236 36,356 31.679 27.408 22,516 1,383 (188) 1,063 (138)...
Please solve this question
I want to solve this question on the attached
tables
Analyzing a company for Its Investment Potential In its annual report, WRS Athletic Supply, Inc., includes the following five-year financial summary. WRS ATHLETIC SUPPLY, INC. Five-Year Financial Summary (Partial; adapted) 2010 2015 5244,524 2011 5137634 17% 2014 2013 2012 5217799 $191,329 5165,013 16% 20% 6% 5% 1,873 1,787 1,615 171,562 150,255 129,664 9% 2,001 191,838 1.191 108,725 41,236 36,356 31.679 27.408 22,516 1,383 (188) 1,063 (138)...
 i
answer most this budget but please complete it with explain the
slove .. and analyse it
the last photo is a clear slove
Analyzing a Company for its Investment Potential In its annual report, WRS Athletic Supply, Inc., includes the following five-year financial summary. WRS ATHLETIC SUPPLY, INC. Five-Year Financial Summary (Partial adapted) 2010 2011 $137,634 17% 2014 2013 2012 5344,524 5217599 $191,129 $165,013 16% 20% 5% 6% 1,873 1,78 1,615 191,838 171,562 150,235 129,664 96 5% 2,001 1,391...
i
answer most this budget but please complete it with explain the
slove .. and analyse it
the last photo is a clear slove
Analyzing a Company for its Investment Potential In its annual report, WRS Athletic Supply, Inc., includes the following five-year financial summary. WRS ATHLETIC SUPPLY, INC. Five-Year Financial Summary (Partial adapted) 2010 2011 $137,634 17% 2014 2013 2012 5344,524 5217599 $191,129 $165,013 16% 20% 5% 6% 1,873 1,78 1,615 191,838 171,562 150,235 129,664 96 5% 2,001 1,391...
 pleas write clear
and explain
Analyzing a Company for its Investment Potential In its annual report, WRS Athletic Supply, Inc., includes the followin five-year financial summary. 2010 5% 2,001) 2011 5137534 17% 9% 1,391 108,725 WRS ATHLETIC SUPPLY, INC. Five-Year Financial Summary (Partial; adapted) (Dollar amounts in thousands except per share data 2015 2014 Net sales 2013 2012 5244,524 5217799 $191,329 5165,013 Net sales increase 12% 14% 16% 20% Domestic comparative store sales increase 8% Other income-net 1,873 1.787 1,615...
pleas write clear
and explain
Analyzing a Company for its Investment Potential In its annual report, WRS Athletic Supply, Inc., includes the followin five-year financial summary. 2010 5% 2,001) 2011 5137534 17% 9% 1,391 108,725 WRS ATHLETIC SUPPLY, INC. Five-Year Financial Summary (Partial; adapted) (Dollar amounts in thousands except per share data 2015 2014 Net sales 2013 2012 5244,524 5217799 $191,329 5165,013 Net sales increase 12% 14% 16% 20% Domestic comparative store sales increase 8% Other income-net 1,873 1.787 1,615...
 I need help with problem 5.5
to solve for the 2016 ratios and to identify problems with the
company and what the causes may be
250 CHAPTER 5 The Analysis of Financial Statements STUDY QUESTIONS AND PROBLEMS 5.1. Explain how the credit analyst's focus will differ from the investment analyst's focus. 5.2. What are the limitations of financial ratios? 5.3. What do liquidity ratios measure? Activity ratios? Leverage ratios? Profitability ratios? Market ratios? 5.4. How is the Du Pont System...
I need help with problem 5.5
to solve for the 2016 ratios and to identify problems with the
company and what the causes may be
250 CHAPTER 5 The Analysis of Financial Statements STUDY QUESTIONS AND PROBLEMS 5.1. Explain how the credit analyst's focus will differ from the investment analyst's focus. 5.2. What are the limitations of financial ratios? 5.3. What do liquidity ratios measure? Activity ratios? Leverage ratios? Profitability ratios? Market ratios? 5.4. How is the Du Pont System...
 I need help filling in the green spaces for both the Income
Statement and Balance Sheet. Below is Exhibit 1 (Financial and
Operating Data for Cosco).
TIP: use n = 3 for the CAGR calculation.
Please explain using an Excel spreadsheet,
formulas, and a step-by-step analysis/explanation.
Any
help would be appreciated!
EXHIBIT 1
Please use these financial ratio equations:
Liquity Ratios:
544 53 EXHIBIT 1 Selected Financial and Operating Data for Costco Wholesale Corp., Fiscal Years 2000, 2005, 2011, and...
I need help filling in the green spaces for both the Income
Statement and Balance Sheet. Below is Exhibit 1 (Financial and
Operating Data for Cosco).
TIP: use n = 3 for the CAGR calculation.
Please explain using an Excel spreadsheet,
formulas, and a step-by-step analysis/explanation.
Any
help would be appreciated!
EXHIBIT 1
Please use these financial ratio equations:
Liquity Ratios:
544 53 EXHIBIT 1 Selected Financial and Operating Data for Costco Wholesale Corp., Fiscal Years 2000, 2005, 2011, and...
 Just see the data tiger prawn ignore another, please i really
need your help ???
(g) Mangrove forests in the coastal areas are diminishing (X-axis) and the price of marine fish. (5 marks) (h) Increase in illegal and unreported fishing (X-axis) and fish population in the seas. (5 marks) (b) Given demand for the above individual fish or prawn species is 1,500 tons per annum for year 1996, and also assume demand growth solely depends on population growth at 3%...
Just see the data tiger prawn ignore another, please i really
need your help ???
(g) Mangrove forests in the coastal areas are diminishing (X-axis) and the price of marine fish. (5 marks) (h) Increase in illegal and unreported fishing (X-axis) and fish population in the seas. (5 marks) (b) Given demand for the above individual fish or prawn species is 1,500 tons per annum for year 1996, and also assume demand growth solely depends on population growth at 3%...
 Please solve this question
Analyzing a Company for Its Investment Potential In its annual report, WRS Athletic Supply, Inc., includes the following five-year financial summary. WRS ATHLETIC SUPPLY, INC. Five-Year Financial Summary (Partial; adapted) 2010 2015 5244,524 12% 2013 2012 $191,329 5165,013 16% 2011 $137,634 17% 2014 $217,799 14% 6% 1,873 171,562 16% 5% 20% 8% 2,001 191,838 1,787 150,255 1,615 129,664 1,391 108,725 41,236 36,356 31,679 27,408 22,516 1,063 (138) 4,487 8,039 1357 (171) 3,897 6,671 1,383 (188) 3,692...
Please solve this question
Analyzing a Company for Its Investment Potential In its annual report, WRS Athletic Supply, Inc., includes the following five-year financial summary. WRS ATHLETIC SUPPLY, INC. Five-Year Financial Summary (Partial; adapted) 2010 2015 5244,524 12% 2013 2012 $191,329 5165,013 16% 2011 $137,634 17% 2014 $217,799 14% 6% 1,873 171,562 16% 5% 20% 8% 2,001 191,838 1,787 150,255 1,615 129,664 1,391 108,725 41,236 36,356 31,679 27,408 22,516 1,063 (138) 4,487 8,039 1357 (171) 3,897 6,671 1,383 (188) 3,692...
Most questions answered within 3 hours.
-
Calculate the pH of each of the following solutions.
0.50 M HBr
3.1×10⁻⁴ M KOH
4.2×10⁻⁵...
asked 39 minutes ago -
For the year ended December 31, Depot Max’s cost of merchandise
sold was $85,600. Inventory at the...
asked 39 minutes ago -
Week 10 - Professional Memo Assignment
Professional Memo Assignment
Your mission for this week, should you...
asked 43 minutes ago -
Write a Python program that stores the data for each
player on the team, and it...
asked 54 minutes ago -
In
the last 3 months, mike never knows when he is going to get his
allowance...
asked 1 hour ago -
Is Ca(OH)2 a Bronsted base, Lewis base, or both? Why?
asked 1 hour ago -
1A- Why don’t voters complain about U.S. tariffs on imported
sugar?
Because sugar is only a...
asked 1 hour ago -
Cash Payback Period
Primera Banco is evaluating two capital investment proposals for
a drive-up ATM kiosk,...
asked 1 hour ago -
Create a button in Swift (Xcode) that will create a charge,
create a charge using Stripe's...
asked 1 hour ago -
The reaction rate of CO and NO2 in the reaction
CO(g) + NO2(g) → CO2(g) +...
asked 1 hour ago -
Imagine that a chemist puts 6.40 mol each of
C3H8 and O2 in a 1.00-L container...
asked 1 hour ago -
How much money should be invested today in order to have $8340
at the end of...
asked 1 hour ago