
Homework Answers
(a)
Following table shows the calculations:
| X | Y | X^2 | Y^2 | XY | |
| 1 | 19 | 1 | 361 | 19 | |
| 2 | 33 | 4 | 1089 | 66 | |
| 4 | 45 | 16 | 2025 | 180 | |
| 6 | 40 | 36 | 1600 | 240 | |
| 10 | 52 | 100 | 2704 | 520 | |
| 14 | 53 | 196 | 2809 | 742 | |
| 20 | 54 | 400 | 2916 | 1080 | |
| Total | 57 | 296 | 753 | 13504 | 2847 |
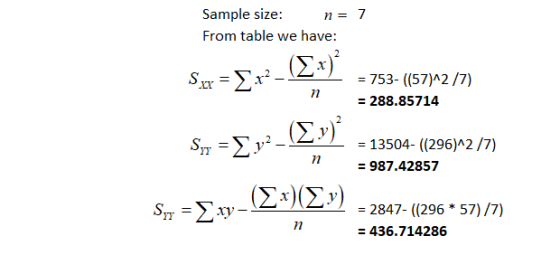
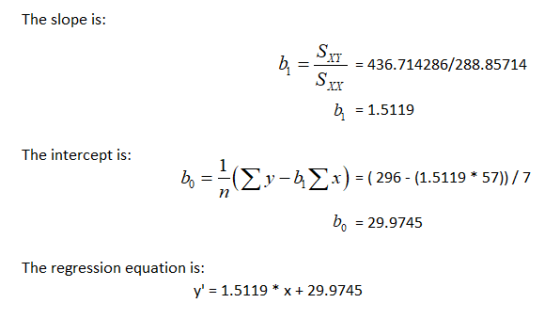
Answer: 1.51*x+29.97
(b)


-----------------
Since there is 2 variables so we have k=2. Therefore degree of freedoms are:


-------------
Now


F test statistics is

Add Answer to:
Data on advertising expenditures and revenue (in thousands of dollars) for the Four Seasons Restaurant follow....
Data on advertising expenditures and revenue (in thousands of dollars) for the Four Seasons Restaurant follow....
 Data on advertising expenditures and revenue (in thousands of dollars) for the Four Seasons Restaurant follow. Advertising Expenditures Revenue 1 19 2 32 4 44 6 40 10 52 14 53 54 + 20 a. Let x equal advertising expenditures and y equal revenue. Complete the estimated regression equation below (to 2 decimals). y= X b. Test whether revenue and advertising expenditures are related at a .05 level of significance. Compute the following (to 2 decimals). 2 SSE x SST...
Data on advertising expenditures and revenue (in thousands of dollars) for the Four Seasons Restaurant follow...
 Data on advertising expenditures and revenue (in thousands of dollars) for the Four Seasons Restaurant follow Advertising Expenditures 2 4 6 10 14 20 Revenue 20 32 45 40 53 54 a. Let x equal advertising expenditures and y equal revenue. Complete the estimated regression equation below (to 2 decimals) b. Compute the following (to 1 decimal) SSE SST SSR MSR MSE c. Test whether revenue and advertising expenditures are related at a .05 level of significance. Compute the F...
Data on advertising expenditures and revenue (in thousands of dollars) for the Restaurant follow. Advertising Expenditures...
Data on advertising expenditures and revenue (in thousands of dollars) for the Restaurant follow. Advertising Expenditures Revenue 1 20 2 33 4 45 6 40 10 53 14 54 20 55 Let x equal advertising expenditures and y equal revenue. Complete the estimated regression equation below. y = 1.47 + 30.87 Test whether revenue and advertising expenditures are related at a .05 level of significance. SSE = SST = SSR = MSR = MSE= F test statistic = P-value =
A shoe store developed the following estimated regression equation relating sales to inventory investment and advertising...
 A shoe store developed the following estimated regression equation relating sales to inventory investment and advertising expenditures where 1inventory investment ($1000s) = advertising expenditures ($1000s) y sales ($1000s) The data used to develop the model came from a survey of 10 stores; for those data, SST 16,000 and SSR a. Compute SSE, MSE, and MSR (to 2 decimals, if necessary) 12,000 SSE MSE MSR b. Use an F test and α .05 level of significance to determine whether there is...
The exercise involving data in this and subsequent sections were designed to be solved using Excel....
 The exercise involving data in this and subsequent sections were designed to be solved using Excel. The following estimated regression equation is based on 10 observations was presented. j29.12700.5906x1 +0.4980x2 Here SST 6,877.125, SSR = 6,320.875, s», = 0.0824, and s 0.0658 a. Compute MSR and MSE (to 3 decimals). MSR MSE b. Compute the F test statistic (to 2 decimals). Use Ftable. What is the p-value? Select your answer At a .05, what is your conclusion? - Select your...
The exercise involving data in this and subsequent sections were designed to be solved using Excel....
 The exercise involving data in this and subsequent sections were designed to be solved using Excel. The following estimated regression equation is based on 10 observations was presented. ŷ = 29.1270 + 0.5906x1 +0.4980:22 Here SST = 6,614.875, SSR = 6,040.125, Sb, = 0.0812, and Sb= 0.0696. a. Compute MSR and MSE (to 3 decimals). MSR MSE b. Compute the F test statistic (to 2 decimals). Use F table. What is the p-value? ( - Select your answer - At...
The exercise involving data in this and subsequent sections were designed to be solved using Excel....
 The exercise involving data in this and subsequent sections were designed to be solved using Excel. The following estimated regression equation is based on 10 observations was presented. y = 29.1270 +0.590601 +0.4980:3 Here SST = 6,565.375, SSR = 6,190.250, 81 = 0.0814, and 81% = 0.0546 a. Compute MSR and MSE (to 3 decimals). MSR MSE b. Compute the F test statistic (to 2 decimals). Use Ftable. What is the p-value? - Select your answer - At a=.05, what...
eBook Video The exercise involving data in this and subsequent sections were designed to be solved...
 eBook Video The exercise involving data in this and subsequent sections were designed to be solved using Excel The following estimated regression equation is based on 10 observations was presented. ý=29.1270+0.5906, +0.4980ry Here SST 6,891.125, SSR-6,315.000, 0.0848, and a-0.0634. a. Compute MSR and MSE (to 3 decimals). MSR MSE b. Compute the P test statistic (to 2 decimals). Use F table. What is the p-value? Select your answer At a 05, what is your conclusion? Select your answer c. Compute...
The exercise involving data in this and subsequent sections were designed to be solved using Excel....
 The exercise involving data in this and subsequent sections were designed to be solved using Excel. The following estimated regression equation is based on 10 observations was presented. y = 29.1270+ 0.5906x1 +0.4980x2 Here SST = 6,765.750, SSR = 6,527.625, 8b, = 0.0786, and 8ty = 0.0690. a. Compute MSR and MSE (to 3 decimals). MSR MSE b. Compute the F test statistic (to 2 decimals). Use Ftable. What is the p-value? - Select your answer - At a =...
lework The exercise involving data in this and subsequent sections were designed to be solved using Excel. The foll...
 lework The exercise involving data in this and subsequent sections were designed to be solved using Excel. The following estimated regression equation is based on 10 observations was presented. | 9= 29.1270 +0.5906zI +0.498022 Here SST = 6,863.625, SSR = 6,273.500, sb, = 0.0744, and Sby = 0.0555. a. Compute MSR and MSE (to 3 decimals). MSR MSE b. Compute the F test statistic (to 2 decimals). Use F table. What is the p-value? - Select your answer - At...
 Data on advertising expenditures and revenue (in thousands of dollars) for the Four Seasons Restaurant follow. Advertising Expenditures Revenue 1 19 2 32 4 44 6 40 10 52 14 53 54 + 20 a. Let x equal advertising expenditures and y equal revenue. Complete the estimated regression equation below (to 2 decimals). y= X b. Test whether revenue and advertising expenditures are related at a .05 level of significance. Compute the following (to 2 decimals). 2 SSE x SST...
 Data on advertising expenditures and revenue (in thousands of dollars) for the Four Seasons Restaurant follow Advertising Expenditures 2 4 6 10 14 20 Revenue 20 32 45 40 53 54 a. Let x equal advertising expenditures and y equal revenue. Complete the estimated regression equation below (to 2 decimals) b. Compute the following (to 1 decimal) SSE SST SSR MSR MSE c. Test whether revenue and advertising expenditures are related at a .05 level of significance. Compute the F...
 A shoe store developed the following estimated regression equation relating sales to inventory investment and advertising expenditures where 1inventory investment ($1000s) = advertising expenditures ($1000s) y sales ($1000s) The data used to develop the model came from a survey of 10 stores; for those data, SST 16,000 and SSR a. Compute SSE, MSE, and MSR (to 2 decimals, if necessary) 12,000 SSE MSE MSR b. Use an F test and α .05 level of significance to determine whether there is...
 The exercise involving data in this and subsequent sections were designed to be solved using Excel. The following estimated regression equation is based on 10 observations was presented. j29.12700.5906x1 +0.4980x2 Here SST 6,877.125, SSR = 6,320.875, s», = 0.0824, and s 0.0658 a. Compute MSR and MSE (to 3 decimals). MSR MSE b. Compute the F test statistic (to 2 decimals). Use Ftable. What is the p-value? Select your answer At a .05, what is your conclusion? - Select your...
 The exercise involving data in this and subsequent sections were designed to be solved using Excel. The following estimated regression equation is based on 10 observations was presented. ŷ = 29.1270 + 0.5906x1 +0.4980:22 Here SST = 6,614.875, SSR = 6,040.125, Sb, = 0.0812, and Sb= 0.0696. a. Compute MSR and MSE (to 3 decimals). MSR MSE b. Compute the F test statistic (to 2 decimals). Use F table. What is the p-value? ( - Select your answer - At...
 The exercise involving data in this and subsequent sections were designed to be solved using Excel. The following estimated regression equation is based on 10 observations was presented. y = 29.1270 +0.590601 +0.4980:3 Here SST = 6,565.375, SSR = 6,190.250, 81 = 0.0814, and 81% = 0.0546 a. Compute MSR and MSE (to 3 decimals). MSR MSE b. Compute the F test statistic (to 2 decimals). Use Ftable. What is the p-value? - Select your answer - At a=.05, what...
 eBook Video The exercise involving data in this and subsequent sections were designed to be solved using Excel The following estimated regression equation is based on 10 observations was presented. ý=29.1270+0.5906, +0.4980ry Here SST 6,891.125, SSR-6,315.000, 0.0848, and a-0.0634. a. Compute MSR and MSE (to 3 decimals). MSR MSE b. Compute the P test statistic (to 2 decimals). Use F table. What is the p-value? Select your answer At a 05, what is your conclusion? Select your answer c. Compute...
 The exercise involving data in this and subsequent sections were designed to be solved using Excel. The following estimated regression equation is based on 10 observations was presented. y = 29.1270+ 0.5906x1 +0.4980x2 Here SST = 6,765.750, SSR = 6,527.625, 8b, = 0.0786, and 8ty = 0.0690. a. Compute MSR and MSE (to 3 decimals). MSR MSE b. Compute the F test statistic (to 2 decimals). Use Ftable. What is the p-value? - Select your answer - At a =...
 lework The exercise involving data in this and subsequent sections were designed to be solved using Excel. The following estimated regression equation is based on 10 observations was presented. | 9= 29.1270 +0.5906zI +0.498022 Here SST = 6,863.625, SSR = 6,273.500, sb, = 0.0744, and Sby = 0.0555. a. Compute MSR and MSE (to 3 decimals). MSR MSE b. Compute the F test statistic (to 2 decimals). Use F table. What is the p-value? - Select your answer - At...
Most questions answered within 3 hours.
-
An explosion breaks a 20.0-kg object into three parts. The
object is initially moving at a...
asked 1 minute from now -
Calculate the approximate number of residues of Rubisco, which
is involved in carbon fixation in plants,...
asked 58 minutes ago -
Other decisions about scientific claims can have a much broader
impact.ENERGYarrow-10x10.png, environment, health, security - all...
asked 1 hour ago -
I need to write a research paper and work cited about this
topic: The United States...
asked 2 hours ago -
Hello! I was wondering if I could have some help?
If the vapor pressure of carvone...
asked 2 hours ago -
An economist wants to estimate the mean per capita income (in
thousands of dollars) for a...
asked 2 hours ago -
What would be the input/output characteristic of a circuit
obtained by putting two of your 2's-complementers...
asked 2 hours ago -
In Drosophila, the transition from the syncytial blastoderm
stage to the cellular blastoderm stage is a...
asked 3 hours ago -
Project management question:
Name 3 different types of resources (hint: humans are one
type)
asked 3 hours ago -
Consider the following reaction: C 2H 2( g) + 2H 2( g) C 2H 6(
g)...
asked 3 hours ago -
Consider a 1.0 L buffer containing 0.092 mol L-1 HCOOH and 0.100
mol L-1 HCOO-. What...
asked 3 hours ago -
Koch Realty has owned a vacant land with a FMV of
$775,000 and an adjusted basis...
asked 3 hours ago