
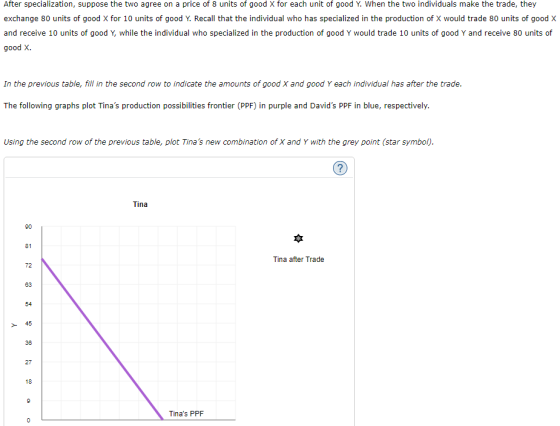

After specialization, suppose the two agree on a price of 8 units of good X for each unit of good Y. When the two individuals make the trade, they exchange 80 units of good X for 10 units of good Y. Recall that the individual who has specialized in the production of X would trade 80 units of good X and receive 10 units of good Y, while the individual who specialized in the production of good Y would trade 10 units of good Y and receive 80 units of good X. In the previous table, fill in the second row to indicate the amounts of good X and good Y each individual has after the trade. The following graphs plot Tina's production possibilities frontier (PPF) in purple and David's PPF in blue, respectively. Using the second row of the previous table, plot Tina's new combination of X and Y with the grey point (star symbol) ? Tina 90 81 Tina after Trade 72 63 54 45 36 27 18 Tina's PPF 0
Using the second row of the previous table, plot David's new combination of X and Y with the tan point (dash symbol). ? David 40 38 David after Trade 32 28 24 David's PPF 20 16 12 4 0 0 24 48 72 98 120 144 168 192 216 240 X True or False: This combination of X and Y was already attainable to these individuals before the trade. True False
Homework Answers


Add Answer to:
7. Working with Numbers and Graphs Q9 The following table summarizes the combinations of goods X...
The following table summarizes the combinations of goods X and Y that two individuals, Tina and...
 The following table summarizes the combinations of goods X and Y that two individuals, Tina and David, can each produce individually. Tina X Y 1000 50 5 0 10 David XY 1500 75 37.5 0 75 fesch person specializes in the production of the good for which they have the comparative advantage, then would specialize in the production of good Y, and would specialize in the production of good X. (Hint: Calculate the opportunity cost of producing X and Y...
a) True b) False Note: This whole problem is just one question but consists of many...
 a) True
b) False
Note: This whole problem is just one question but consists of
many parts. I would highly, extremely appreciate it if someone
could solve this whole thing for me, this is tricky.
9. Working with Numbers and Graphs Q9 The following table summarizes the combinations of goods X and Y that two individuals, Tina and David, can each produce individually. Tina David 250 02000 125 62.5 100 10 0 125 0 20 If each person specializes in...
a) True
b) False
Note: This whole problem is just one question but consists of
many parts. I would highly, extremely appreciate it if someone
could solve this whole thing for me, this is tricky.
9. Working with Numbers and Graphs Q9 The following table summarizes the combinations of goods X and Y that two individuals, Tina and David, can each produce individually. Tina David 250 02000 125 62.5 100 10 0 125 0 20 If each person specializes in...
Can someone please explain how to fill out the table of Before and After Trade. I...
 Can someone please explain how to fill out the table of Before
and After Trade. I have seen other examples, but I cannot see the
relation.
We were unable to transcribe this imageWe were unable to transcribe this imageWe were unable to transcribe this imageWe were unable to transcribe this image< Back to Assignment Attempts: Average: 75 9. Working with Numbers and Graphs Q9 The following table summarizes the combinations of goods X and Y that two individuals, Tina and...
Can someone please explain how to fill out the table of Before
and After Trade. I have seen other examples, but I cannot see the
relation.
We were unable to transcribe this imageWe were unable to transcribe this imageWe were unable to transcribe this imageWe were unable to transcribe this image< Back to Assignment Attempts: Average: 75 9. Working with Numbers and Graphs Q9 The following table summarizes the combinations of goods X and Y that two individuals, Tina and...
1. Working with Numbers and Graphs Q1 Suppose that two economies, named Arcardia and Euphoria, can...
 1. Working with Numbers and Graphs Q1 Suppose that two economies, named Arcardia and Euphoria, can use their resources to produce good X, good Y, or a combination of both. The following table shows the four different combinations of the two goods each country can produce. Combinations A B C D Arcardia Euphoria Good X Good Y Good X Good Y 2400 6400 144 240 460 120 48 480 280 240 0 7200 360 Arcardia has a comparative advantage in...
1. Suppose country A can produce 30 units of Corn per time period (if it specializes...
1. Suppose country A can produce 30 units of Corn per time period (if it specializes in Corn). Country A can produce 4 outfits per time period (if it specializes in outfits). If country B specializes in Corn, it can produce 40 units per time period. If country B specialized in Outfits, it can produce 3 outfits per time period. A has a comparative advantage in Corn. B has a comparative advantage in Outfits. neither country has a comparative advantage....
Tom and Jerry are two severely competitive rivals who like both milk and cheese. Their weekly production possibilities a...
Tom and Jerry are two severely competitive rivals who like both milk and cheese. Their weekly production possibilities are shown in the following table. Choices Tom Jerry Milk Cheese Milk Cheese Choice A 50oz 0 24oz 0 Choice B 0 10oz 0 8oz Who has absolute advantage in Milk? Why? Who has absolute advantage in Cheese? Why? Who has comparative advantage in Milk? Why? Who has comparative advantage in Cheese? Why Draw Tom PPC [keep cheese on the x axis...
U Question 23 8 pts Using the data in the accompanying table, answer the following questions:...
 U Question 23 8 pts Using the data in the accompanying table, answer the following questions: For which good does Canada have a comparative advantage? Select) > For which good does Italy have a comparative advantage? [Select Currently, Canada's economy is producing and consuming at point B, and Italy's economy is producing and consuming at point C. If both agree to specialize and trade at the term 40X-40, determine what gains for both countries.(example 1x:17) Canada's gains in the specialization-trade...
1) True 2) False 7. Specialization and trade When a country specializes in the production of...
 1) True
2) False
7. Specialization and trade When a country specializes in the production of a good, this means that it can produce this good at a lower opportunity cost than its trading partner. Because of this comparative advantage, both countries benefit when they specialize and trade with each other The following graphs show the production possibilities frontiers (PPFs) for Candonia and Lamponia. Both countries produce grain and tea, each initially i.e., before specialization and trade) producing 24 million...
1) True
2) False
7. Specialization and trade When a country specializes in the production of a good, this means that it can produce this good at a lower opportunity cost than its trading partner. Because of this comparative advantage, both countries benefit when they specialize and trade with each other The following graphs show the production possibilities frontiers (PPFs) for Candonia and Lamponia. Both countries produce grain and tea, each initially i.e., before specialization and trade) producing 24 million...
In the following table, enter each country's production decision on the third row of the table...
 In the following table, enter each country's production decision on the third row of the table (marked "Production") Suppose the country that produces jeans trades 26 million pairs of jeans to the other country in exchange for 78 million bushels of corn In the following table, select the amount of each good that each country exports and imports in the boxes across the row marked "Trade Action," and enter each country's final consumption of each good on the line marked...
1. Given the following table showing various combinations of goods X and Y that bring equal...
 1. Given the following table showing various combinations of goods X and Y that bring equal satisfaction to an individual consumer: good X good Y 2 units 3 units 4 units 5 units 10 units 9 units 6 units 2 units In this table, as the individual consumes a greater amount of X, a amount of good Y is given up for each additional unit of good X. This pattern suggests that, as more of good X is consumed and...
 The following table summarizes the combinations of goods X and Y that two individuals, Tina and David, can each produce individually. Tina X Y 1000 50 5 0 10 David XY 1500 75 37.5 0 75 fesch person specializes in the production of the good for which they have the comparative advantage, then would specialize in the production of good Y, and would specialize in the production of good X. (Hint: Calculate the opportunity cost of producing X and Y...
 a) True
b) False
Note: This whole problem is just one question but consists of
many parts. I would highly, extremely appreciate it if someone
could solve this whole thing for me, this is tricky.
9. Working with Numbers and Graphs Q9 The following table summarizes the combinations of goods X and Y that two individuals, Tina and David, can each produce individually. Tina David 250 02000 125 62.5 100 10 0 125 0 20 If each person specializes in...
a) True
b) False
Note: This whole problem is just one question but consists of
many parts. I would highly, extremely appreciate it if someone
could solve this whole thing for me, this is tricky.
9. Working with Numbers and Graphs Q9 The following table summarizes the combinations of goods X and Y that two individuals, Tina and David, can each produce individually. Tina David 250 02000 125 62.5 100 10 0 125 0 20 If each person specializes in...
 Can someone please explain how to fill out the table of Before
and After Trade. I have seen other examples, but I cannot see the
relation.
We were unable to transcribe this imageWe were unable to transcribe this imageWe were unable to transcribe this imageWe were unable to transcribe this image< Back to Assignment Attempts: Average: 75 9. Working with Numbers and Graphs Q9 The following table summarizes the combinations of goods X and Y that two individuals, Tina and...
Can someone please explain how to fill out the table of Before
and After Trade. I have seen other examples, but I cannot see the
relation.
We were unable to transcribe this imageWe were unable to transcribe this imageWe were unable to transcribe this imageWe were unable to transcribe this image< Back to Assignment Attempts: Average: 75 9. Working with Numbers and Graphs Q9 The following table summarizes the combinations of goods X and Y that two individuals, Tina and...
 1. Working with Numbers and Graphs Q1 Suppose that two economies, named Arcardia and Euphoria, can use their resources to produce good X, good Y, or a combination of both. The following table shows the four different combinations of the two goods each country can produce. Combinations A B C D Arcardia Euphoria Good X Good Y Good X Good Y 2400 6400 144 240 460 120 48 480 280 240 0 7200 360 Arcardia has a comparative advantage in...
 U Question 23 8 pts Using the data in the accompanying table, answer the following questions: For which good does Canada have a comparative advantage? Select) > For which good does Italy have a comparative advantage? [Select Currently, Canada's economy is producing and consuming at point B, and Italy's economy is producing and consuming at point C. If both agree to specialize and trade at the term 40X-40, determine what gains for both countries.(example 1x:17) Canada's gains in the specialization-trade...
 1) True
2) False
7. Specialization and trade When a country specializes in the production of a good, this means that it can produce this good at a lower opportunity cost than its trading partner. Because of this comparative advantage, both countries benefit when they specialize and trade with each other The following graphs show the production possibilities frontiers (PPFs) for Candonia and Lamponia. Both countries produce grain and tea, each initially i.e., before specialization and trade) producing 24 million...
1) True
2) False
7. Specialization and trade When a country specializes in the production of a good, this means that it can produce this good at a lower opportunity cost than its trading partner. Because of this comparative advantage, both countries benefit when they specialize and trade with each other The following graphs show the production possibilities frontiers (PPFs) for Candonia and Lamponia. Both countries produce grain and tea, each initially i.e., before specialization and trade) producing 24 million...
 In the following table, enter each country's production decision on the third row of the table (marked "Production") Suppose the country that produces jeans trades 26 million pairs of jeans to the other country in exchange for 78 million bushels of corn In the following table, select the amount of each good that each country exports and imports in the boxes across the row marked "Trade Action," and enter each country's final consumption of each good on the line marked...
 1. Given the following table showing various combinations of goods X and Y that bring equal satisfaction to an individual consumer: good X good Y 2 units 3 units 4 units 5 units 10 units 9 units 6 units 2 units In this table, as the individual consumes a greater amount of X, a amount of good Y is given up for each additional unit of good X. This pattern suggests that, as more of good X is consumed and...
Most questions answered within 3 hours.
-
Calculate the pH of each of the following solutions.
0.50 M HBr
3.1×10⁻⁴ M KOH
4.2×10⁻⁵...
asked 51 minutes ago -
For the year ended December 31, Depot Max’s cost of merchandise
sold was $85,600. Inventory at the...
asked 51 minutes ago -
Week 10 - Professional Memo Assignment
Professional Memo Assignment
Your mission for this week, should you...
asked 56 minutes ago -
Write a Python program that stores the data for each
player on the team, and it...
asked 1 hour ago -
In
the last 3 months, mike never knows when he is going to get his
allowance...
asked 1 hour ago -
Is Ca(OH)2 a Bronsted base, Lewis base, or both? Why?
asked 1 hour ago -
1A- Why don’t voters complain about U.S. tariffs on imported
sugar?
Because sugar is only a...
asked 1 hour ago -
Cash Payback Period
Primera Banco is evaluating two capital investment proposals for
a drive-up ATM kiosk,...
asked 1 hour ago -
Create a button in Swift (Xcode) that will create a charge,
create a charge using Stripe's...
asked 1 hour ago -
The reaction rate of CO and NO2 in the reaction
CO(g) + NO2(g) → CO2(g) +...
asked 1 hour ago -
Imagine that a chemist puts 6.40 mol each of
C3H8 and O2 in a 1.00-L container...
asked 1 hour ago -
How much money should be invested today in order to have $8340
at the end of...
asked 1 hour ago