I really need help on these, please make sure to do the ones where I inputted answers because they are wrong. Thank you.


or down becoming more or les The SML line can change due to expected inflation and risk aversion. If inflation changes, then the SML platted on a graph will shift up or down parallel to the ald SML. If risk aversion changes, then the SML plotted an a graph will rotate f its assets and through changes in the amount of debt it uses. steep if investars become more or less risk averse, firm can influence market risk (hence its bcta coefficient) through changes in the compasition Ouantitative Problem: You are given the following information for Wine and Cork Enterprises (WCE) 4%: M- 100 % ; RPM 6%, and beta 1 RF required rate of return? Round vour answer to 2 decimal places, Do not round intermediate calculations What If inflation increases by 3 % but there is na change a not round intermediate calculations. investors risk aversign, what is WCE's required rate Freturn now? Round yaur answer to two decimal places. 9 % 26. What is wCE's required rate of return now? Round your answer o change in inflation, but risk aversion increases two decimal places. Do not round intermediate calculations. Assume now that there is 12 % creases by 3 % and risk aversion increases 2% , what is wCE's required rate of retun now? Round vour answen o two decimal places, Do not round intermediate calculations. If infla
Homework Answers
Add Answer to:
I really need help on these, please make sure to do the ones
where I inputted...
Stocks A and B have the following probability distributions of expected future returns: Probability A B...
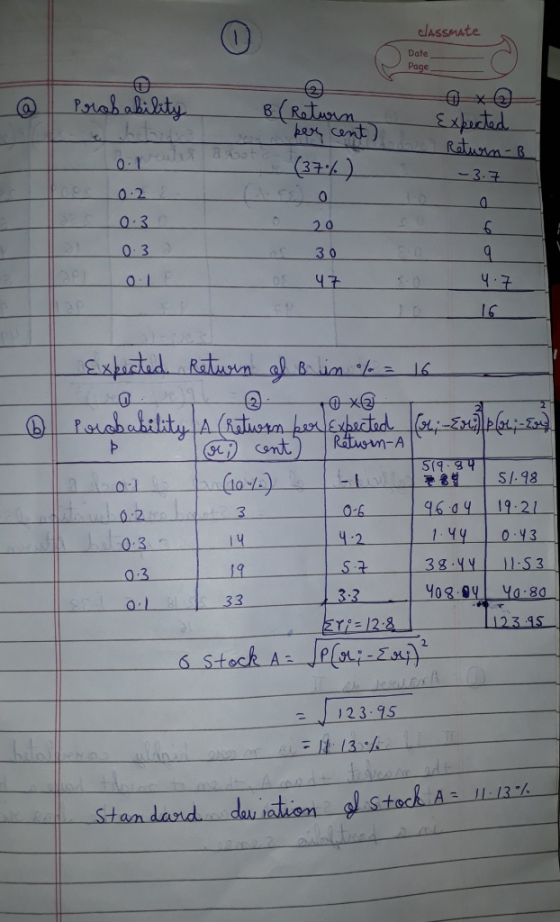
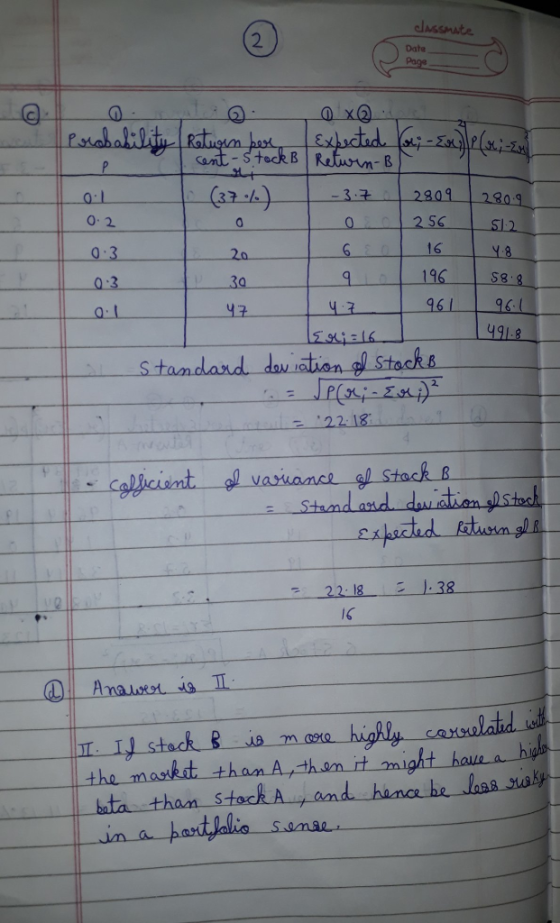
Stocks A and B have the following probability distributions of expected future returns: Probability A B 0.1 (13 %) (22 %) 0.2 6 0 0.5 16 21 0.1 23 27 0.1 39 45 Calculate the expected rate of return, , for Stock B ( = 14.10%.) Do not round intermediate calculations. Round your answer to two decimal places. % Calculate the standard deviation of expected returns, σA, for Stock A (σB = 17.44%.) Do not round intermediate calculations. Round your...
Stocks A and B have the following probability distributions of expected future returns: Probability (119) (34...
 Stocks A and B have the following probability distributions of expected future returns: Probability (119) (34 ) 0.1 0.5 02 0.1 a. Calculate the expected rate of return, for Stock B (TA1440%.) Do not round intermediate calculations. Round your answer to two decimal places. 16 % b. Calculate the standard deviation of expected returns, or for Stock AO = 19.89%.) Do not round intermediate calculations. Round your answer to two decimal Now calculate the coefficient of variation for Stock B....
Stocks A and B have the following probability distributions of expected future returns: Probability A B...
Stocks A and B have the following probability distributions of expected future returns: Probability A B 0.1 (10 %) (35 %) 0.1 3 0 0.5 12 23 0.2 20 25 0.1 30 36 Calculate the expected rate of return, , for Stock B ( = 12.30%.) Do not round intermediate calculations. Round your answer to two decimal places. % Calculate the standard deviation of expected returns, σA, for Stock A (σB = 19.13%.) Do not round intermediate calculations. Round your answer...
8.6 Stocks A and B have the following probability distributions of expected future returns: Probability 0.1...
 8.6
Stocks A and B have the following probability distributions of expected future returns: Probability 0.1 0.1 0.5 А (6%) 5 (25%) 16 0.2 0.1 a. Calculate the expected rate of return, TB, for Stock B (A - 15.30%.) Do not round intermediate calculations. Round your answer to two decimal places. % b. Calculate the standard deviation of expected returns, CA, for Stock A (OB = 18.68%.) Do not round intermediate calculations. Round your answer to two decimal places. Now...
8.6
Stocks A and B have the following probability distributions of expected future returns: Probability 0.1 0.1 0.5 А (6%) 5 (25%) 16 0.2 0.1 a. Calculate the expected rate of return, TB, for Stock B (A - 15.30%.) Do not round intermediate calculations. Round your answer to two decimal places. % b. Calculate the standard deviation of expected returns, CA, for Stock A (OB = 18.68%.) Do not round intermediate calculations. Round your answer to two decimal places. Now...
Stocks A and B have the following probability distributions of expected future returns: Probability 0.1 (8...
 Stocks A and B have the following probability distributions of expected future returns: Probability 0.1 (8 %) (35%) 0.2 0.4 22 0.2 0.1 a. Calculate the expected rate of return, fb, for Stock B (f = 12.00%.) Do not round intermediate calculations. Round your answer to two decimal places. 28 b. Calculate the standard deviation of expected returns, CA, for Stock A (OB = 20.40%.) Do not round intermediate calculations. Round your answer to two decimal places. % Now calculate...
Stocks A and B have the following probability distributions of expected future returns: Probability A B...
Stocks A and B have the following probability distributions of expected future returns: Probability A B 0.1 (14 %) (30 %) 0.1 2 0 0.5 13 20 0.2 24 29 0.1 36 45 Calculate the expected rate of return, , for Stock B ( = 13.70%.) Do not round intermediate calculations. Round your answer to two decimal places. % Calculate the standard deviation of expected returns, σA, for Stock A (σB = 19.01%.) Do not round intermediate calculations. Round your...
Stocks A and B have the following probability distributions of expected future returns: Probability A B...
Stocks A and B have the following probability distributions of expected future returns: Probability A B 0.1 (7 %) (22 %) 0.2 5 0 0.5 14 19 0.1 22 27 0.1 30 36 Calculate the expected rate of return, for Stock B ( = 12.50%.) Do not round intermediate calculations. Round your answer to two decimal places. % Calculate the standard deviation of expected returns, σA, for Stock A (σB = 15.70%.) Do not round intermediate calculations. Round your answer...
8.6 Stocks A and B have the following probability distributions of expected future returns: Probability 0.1 (25%) 0.1 0...
 8.6
Stocks A and B have the following probability distributions of expected future returns: Probability 0.1 (25%) 0.1 0.5 (6%) 5 16 0.2 18 30 0.1 38 50 a. Calculate the expected rate of return, TB, for Stock B ("A - 15.30%.) Do not round intermediate calculations. Round your answer to two decimal places. % b. Calculate the standard deviation of expected returns, CA, for Stock A (OB = 18.68%.) Do not round intermediate calculations. Round your answer to two...
8.6
Stocks A and B have the following probability distributions of expected future returns: Probability 0.1 (25%) 0.1 0.5 (6%) 5 16 0.2 18 30 0.1 38 50 a. Calculate the expected rate of return, TB, for Stock B ("A - 15.30%.) Do not round intermediate calculations. Round your answer to two decimal places. % b. Calculate the standard deviation of expected returns, CA, for Stock A (OB = 18.68%.) Do not round intermediate calculations. Round your answer to two...
Stocks A and B have the following probability distributions of expected future returns: Probability  ...
Stocks A and B have the following probability distributions of expected future returns: Probability A B 0.1 (8 %) (40 %) 0.2 4 0 0.4 14 19 0.2 18 29 0.1 38 45 Calculate the expected rate of return, , for Stock B ( = 13.00%.) Do not round intermediate calculations. Round your answer to two decimal places. % Calculate the standard deviation of expected returns, σA, for Stock A (σB = 21.95%.) Do not round intermediate calculations. Round your...
Stocks A and B have the following probability distributions of expected future returns: Probability A B...
 Stocks A and B have the following probability distributions of expected future returns: Probability A B 0.1 (11 % ) (23 %) 0.2 6 0 0.4 15. 23 0.2 23 27 0.1 39 48 a. Calculate the expected rate of return, rB, for Stock B (rA two decimal places. 14.60 % . ) Do not round intermediate calculations. Round your answer to 11 % b. Calculate the standard deviation of expected returns, aA, for Stock A (oe = 18.66 %...
 Stocks A and B have the following probability distributions of expected future returns: Probability (119) (34 ) 0.1 0.5 02 0.1 a. Calculate the expected rate of return, for Stock B (TA1440%.) Do not round intermediate calculations. Round your answer to two decimal places. 16 % b. Calculate the standard deviation of expected returns, or for Stock AO = 19.89%.) Do not round intermediate calculations. Round your answer to two decimal Now calculate the coefficient of variation for Stock B....
 8.6
Stocks A and B have the following probability distributions of expected future returns: Probability 0.1 0.1 0.5 А (6%) 5 (25%) 16 0.2 0.1 a. Calculate the expected rate of return, TB, for Stock B (A - 15.30%.) Do not round intermediate calculations. Round your answer to two decimal places. % b. Calculate the standard deviation of expected returns, CA, for Stock A (OB = 18.68%.) Do not round intermediate calculations. Round your answer to two decimal places. Now...
8.6
Stocks A and B have the following probability distributions of expected future returns: Probability 0.1 0.1 0.5 А (6%) 5 (25%) 16 0.2 0.1 a. Calculate the expected rate of return, TB, for Stock B (A - 15.30%.) Do not round intermediate calculations. Round your answer to two decimal places. % b. Calculate the standard deviation of expected returns, CA, for Stock A (OB = 18.68%.) Do not round intermediate calculations. Round your answer to two decimal places. Now...
 Stocks A and B have the following probability distributions of expected future returns: Probability 0.1 (8 %) (35%) 0.2 0.4 22 0.2 0.1 a. Calculate the expected rate of return, fb, for Stock B (f = 12.00%.) Do not round intermediate calculations. Round your answer to two decimal places. 28 b. Calculate the standard deviation of expected returns, CA, for Stock A (OB = 20.40%.) Do not round intermediate calculations. Round your answer to two decimal places. % Now calculate...
 8.6
Stocks A and B have the following probability distributions of expected future returns: Probability 0.1 (25%) 0.1 0.5 (6%) 5 16 0.2 18 30 0.1 38 50 a. Calculate the expected rate of return, TB, for Stock B ("A - 15.30%.) Do not round intermediate calculations. Round your answer to two decimal places. % b. Calculate the standard deviation of expected returns, CA, for Stock A (OB = 18.68%.) Do not round intermediate calculations. Round your answer to two...
8.6
Stocks A and B have the following probability distributions of expected future returns: Probability 0.1 (25%) 0.1 0.5 (6%) 5 16 0.2 18 30 0.1 38 50 a. Calculate the expected rate of return, TB, for Stock B ("A - 15.30%.) Do not round intermediate calculations. Round your answer to two decimal places. % b. Calculate the standard deviation of expected returns, CA, for Stock A (OB = 18.68%.) Do not round intermediate calculations. Round your answer to two...
 Stocks A and B have the following probability distributions of expected future returns: Probability A B 0.1 (11 % ) (23 %) 0.2 6 0 0.4 15. 23 0.2 23 27 0.1 39 48 a. Calculate the expected rate of return, rB, for Stock B (rA two decimal places. 14.60 % . ) Do not round intermediate calculations. Round your answer to 11 % b. Calculate the standard deviation of expected returns, aA, for Stock A (oe = 18.66 %...
Most questions answered within 3 hours.
-
38%
of adults say cashews are their favorite kind of nut. You
randomly select 12 adults...
asked 1 hour ago -
Notational Inc. is considering installing a new server. The
machine costs $100,000 and is expected to...
asked 1 hour ago -
Given the information coding of DNA strand:
5'-TTT-TAC-GAA-GAG-TGA-3',
Write the corresponding DNA template and mRNA strand...
asked 1 hour ago -
2. Boris recently synthesized an explosive compound he named
Badenoughium. The molecular formula for Bdenoughium is...
asked 5 hours ago -
5. A car decelerate evenly from a velocity of 50mph until rest
in a distance of...
asked 5 hours ago -
IN HTML Programming
1. Write a script that inputs integers (one at a time) and
passes...
asked 5 hours ago -
A dentist uses a mirror to examine a tooth that is 0.75 cm in
front of...
asked 5 hours ago -
You set up a 100,000 line of credit for the business on 1/1/X8,
annual interest is...
asked 5 hours ago -
What is the measurement uncertainty of a pan balance? How did you
get that?
asked 5 hours ago -
Suppose four firms have market shares of 30%, 30%, 20% and 20%.
What is the Herfindahl-Hirschman...
asked 6 hours ago -
IBT Industrial Solutions produces forty units of rack and pinion
type steering gears during an eight...
asked 6 hours ago -
The Ksp for PbI2 is 9.8×10⁻⁹ . Will PbI2 precipitate if 2.5 mL
of 0.0025 M...
asked 6 hours ago