
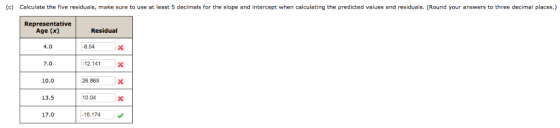
(c) Calculate the five residuals, make sure to use at least 5 decimals for the slope and intercept when calculating the predicted values and residuals. (Round your answers to three decimal places.) Representative Age (x) Residual 4.0 -8.54 7,0 -12.141 26.869 10.0 10.04 13.5 -16.174 17.0
Homework Answers
| X | Y | (x-x̅)² | (y-ȳ)² | (x-x̅)(y-ȳ) |
| 4 | 543.3 | 39.69 | 10355.10 | 641.09 |
| 7 | 585 | 10.89 | 3607.20 | 198.20 |
| 10 | 666.3 | 0.09 | 451.14 | -6.37 |
| 13.5 | 702.1 | 10.24 | 3253.56 | 182.53 |
| 17 | 728.6 | 44.89 | 6978.93 | 559.72 |
| ΣX | ΣY | Σ(x-x̅)² | Σ(y-ȳ)² | Σ(x-x̅)(y-ȳ) | |
| total sum | 51.5 | 3225.3 | 105.8 | 24645.9 | 1575.16 |
| mean | 10.30 | 645.06 | SSxx | SSyy | SSxy |
sample size , n = 5
here, x̅ = Σx / n= 10.30 ,
ȳ = Σy/n = 645.06
SSxx = Σ(x-x̅)² = 105.8000
SSxy= Σ(x-x̅)(y-ȳ) = 1575.2
estimated slope , ß1 = SSxy/SSxx = 1575.2
/ 105.800 = 14.8881
intercept, ß0 = y̅-ß1* x̄ =
491.7127
so, regression line is Ŷ =
491.712665 + 14.888091
*x
c)
| X | Ŷ | residual,ei=y-yhat | ||||
| 4 | 551.27 | -7.965 | ||||
| 7 | 595.93 | -10.929 | ||||
| 10 | 640.59 | 25.706 | ||||
| 13.5 | 692.70 | 9.398 | ||||
| 17 | 744.81 | -16.210 |
Add Answer to:
6 minutes. For each age group shown in the table, the median distance walked Two hundred...
Two hundred and eighty boys completed a test that measures the distance that the subject can...
 Two hundred and eighty boys completed a test that measures the distance that the subject can walk on a flat, hard surface in 6 minutes. For each age group shown in the table, the median distance walked by the boys in that age group is also given. Age Group Representative Age (Midpoint of Age Group) Median Six-Minute Walk Distance (meters) 3-5 4 544.3 6-8 7 584.0 9-11 10 667.3 12-15 13.5 701.1 16-18 17 727.6 This experiment also reported the...
 Two hundred and eighty boys completed a test that measures the distance that the subject can walk on a flat, hard surface in 6 minutes. For each age group shown in the table, the median distance walked by the boys in that age group is also given. Age Group Representative Age (Midpoint of Age Group) Median Six-Minute Walk Distance (meters) 3-5 4 544.3 6-8 7 584.0 9-11 10 667.3 12-15 13.5 701.1 16-18 17 727.6 This experiment also reported the...
Most questions answered within 3 hours.
-
Bernie's Beverages purchased some fixed assets classified as
5-year property for MACRS. The assets cost $28,000....
asked 11 minutes ago -
How many ATPs are produced from the catabolism of a 10-C
molecule of fatty acid under...
asked 15 minutes ago -
Before practicing a routine on the rings, a 64.8 kg gymnast
hangs motionless, with one hand...
asked 17 minutes ago -
If the K b of a weak base is 6.3 × 10 − 6 , what...
asked 23 minutes ago -
Which of the following is the minimum amount of moles of NaOH
that must be added...
asked 27 minutes ago -
Stories about organizational ________ provide important clues
about cultural values and norms.
a. myths
b. heroes...
asked 29 minutes ago -
Explain the criteria used in selecting a target market
BUS220 Retail Management, thank you!
asked 31 minutes ago -
Convert/Calculate the following:
Determine the identity of an elemental gas if 4.55 L weighing
35.4g, under...
asked 34 minutes ago -
Consider the equilibrium C(s)+ CO2(g) ⇌2 CO(g)
A 2.0 L flask contains a mixture of 0.10...
asked 33 minutes ago -
MATLAB
Part 1 – randFloatValue.m This function accepts two numbers,
lower and upper, and returns a...
asked 39 minutes ago -
You have been asked to hide prizes around your house for your
3-year old nephew. His...
asked 40 minutes ago -
Ammonia will decompose into nitrogen and hydrogen at high
temperature. An industrial chemist studying this reaction...
asked 47 minutes ago