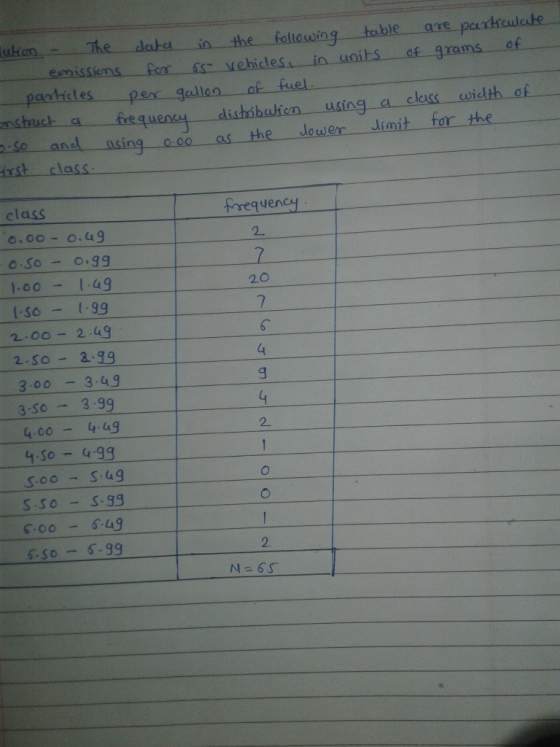
The data in the following table are particulate emissions for 65 vehicles, in units of grams...
The data in the following table are particulate emissions for 65 vehicles, in units of grams of particles per gallon of fuel. Construct a frequency distribution using a class width of 0.50, and using 0.00 as the lower limit for the first class.
| 1.49 | 0.87 | 1.11 | 1.24 | 3.47 | 1.11 | 1.12 | 0.87 | 1.30 | 0.94 | 0.63 | 1.31 | 2.49 |
| 1.48 | 1.06 | 1.12 | 2.15 | 0.87 | 1.82 | 1.46 | 1.25 | 1.63 | 2.13 | 6.65 | 4.05 | 2.48 |
| 1.42 | 1.35 | 1.81 | 1.13 | 1.63 | 3.68 | 0.55 | 2.65 | 2.62 | 3.03 | 1.22 | 1.04 | 1.64 |
| 3.14 | 2.36 | 2.11 | 2.69 | 1.17 | 3.35 | 3.80 | 1.28 | 2.10 | 6.56 | 1.17 | 3.07 | 0.49 |
| 0.23 | 0.51 | 3.35 | 3.46 | 2.74 | 1.89 | 5.95 | 4.23 | 3.53 | 3.58 | 3.09 | 3.34 | 4.58 |
 |
Send data to Excel |
|
Homework Answers
Add Answer to:
The data in the following table are particulate emissions for 65
vehicles, in units of grams...
Suppose 1000 coins are tossed. Use the normal curve approximation to the binomial distribution to find...
 Suppose 1000 coins are tossed. Use the normal curve approximation to the binomial distribution to find the probability of getting the following result. Exactly 495 heads Use the table of areas under the standard normal curve given below. Click here to view page 1. Click here to view page 2. Click here to view page 3. Click here to view page 4. Click here to view page 5. Click here to view page 6. The probability of getting exactly 495...
Suppose 16 coins are tossed. Use the normal curve approximation to the binomial distribution to find...
 Suppose 16 coins are tossed. Use the normal curve approximation to the binomial distribution to find the probability of getting the following result. More than 11 tails. Use the table of areas under the standard normal curve given below. Click here to view page 1. Click here to view page 2. Click here to view page 3. Click here to view page 4. Click here to view page 5. Click here to view page 6. Binomial probability = (Round to...
 Suppose 1000 coins are tossed. Use the normal curve approximation to the binomial distribution to find the probability of getting the following result. Exactly 495 heads Use the table of areas under the standard normal curve given below. Click here to view page 1. Click here to view page 2. Click here to view page 3. Click here to view page 4. Click here to view page 5. Click here to view page 6. The probability of getting exactly 495...
 Suppose 16 coins are tossed. Use the normal curve approximation to the binomial distribution to find the probability of getting the following result. More than 11 tails. Use the table of areas under the standard normal curve given below. Click here to view page 1. Click here to view page 2. Click here to view page 3. Click here to view page 4. Click here to view page 5. Click here to view page 6. Binomial probability = (Round to...
Most questions answered within 3 hours.
-
A college student is employed as a door-to-door newspaper
salesman. Historical data suggests that the student...
asked 36 minutes ago -
MATLAB HW 11 problem using Switch Case and Input commands
Write a script file that calculates...
asked 21 minutes ago -
Considering gravitational time dilation, calculate the time that
passes in Earth’s surface while 1 hour passes...
asked 1 hour ago -
Minitab Problem: Take the Lake Hume June rainfall data and find
use the processes outlined in...
asked 1 hour ago -
X Company is trying to decide whether to continue using old
equipment to make Product A...
asked 1 hour ago -
IN PYTHON ONLY !! Program 2: Re-work
program #5 (WeeklyHours) from the previous assignment such that...
asked 2 hours ago -
The average length of time between arrivals at a turnpike
toll-booth is 26 seconds. What is...
asked 4 hours ago -
(a) A piston at 6.1 atm contains a gas that occupies a volume of
3.5 L....
asked 5 hours ago -
Please answer true or false. Words
cannot be changed or added in to make it true...
asked 5 hours ago -
An empty test tube weighs 15.923 grams. Then,
MgCl2•6H2O is added into the test tube. After...
asked 5 hours ago -
Assume memory access is 10 units of time and disk access is
10000 units of time....
asked 5 hours ago -
1. Are all good samples random?
2. Magazines often report surveys giving statistics such as “63%...
asked 6 hours ago