
Homework Answers
Add Answer to:
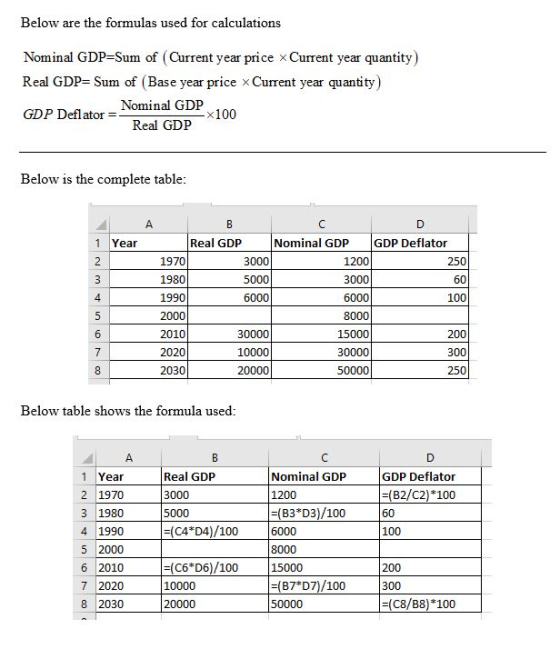
Complete the following table by filling in the missing cells Real GDP (In 2000 dollars) 3,000...
6. Complete the following table: Real GDP Nominal GDP 526.4 1038.5 2789.5 GDP Deflator 21.0 27.5...
 6. Complete the following table: Real GDP Nominal GDP 526.4 1038.5 2789.5 GDP Deflator 21.0 27.5 Year 1960 1970 1980 1990 1995 2000 2003 81.6 5165.7 7112.5 8032.2 7397.7 9817.0 11004.1 100.0 106.0 7. The nominal salary paid to the President of the United States along with the data for the CPI are given for various years below. Year 1920 1940 1960 1980 2000 Presidential Salary 75,000 75,000 100,000 200,000 400,000 CPI (2000 = 100) 11.6 8.1 17.2 47.9 100.0...
Question 1 (1 point) Year Nominal GDP Deflator Real GDP 1980 $12 $24 1990 18...
Question 1 (1 point) Year Nominal GDP Deflator Real GDP 1980 $12 $24 1990 18 75 2000 80 22.5 base 2010 20 20 GDP in trillions of dollars. Fill in the blanks using only integers. Do not use any dollar signs, labels, units, decimals, or points. Blank 1: Blank 2: Blank 3: Blank 4: Question 2 (1 point) The overall trend of nominal GDP appears to be increasing. After converting to real GDP, to 2010 dollars,...
help finish this Apps Managed Service. Assignments: Psy.. m Course: MA 121 (0... Vitalsource: Sign In...
 help finish this
Apps Managed Service. Assignments: Psy.. m Course: MA 121 (0... Vitalsource: Sign In The Beginner's Gu.. Une Remaining Time: 13 minutes, 52 seconds. Question Completion Status: QUESTION ,B: 4800 GDP Deflator Using the chart below, fill in the missing parts (A: 40 10000 .D: 12500 17500 H: 125 Report your answers without any commas. Year Real GDP (base = 2020) 2000 6,000 2005 8,000 2010 2015 12,500 2020 2025 14,000 2030 20,000 Nominal GDP 2,400 В. 8,000...
help finish this
Apps Managed Service. Assignments: Psy.. m Course: MA 121 (0... Vitalsource: Sign In The Beginner's Gu.. Une Remaining Time: 13 minutes, 52 seconds. Question Completion Status: QUESTION ,B: 4800 GDP Deflator Using the chart below, fill in the missing parts (A: 40 10000 .D: 12500 17500 H: 125 Report your answers without any commas. Year Real GDP (base = 2020) 2000 6,000 2005 8,000 2010 2015 12,500 2020 2025 14,000 2030 20,000 Nominal GDP 2,400 В. 8,000...
mework 19.2 Adjusting Nominal Values to Real Values and I Jer Time Question Using the table...
 mework 19.2 Adjusting Nominal Values to Real Values and I Jer Time Question Using the table below, determine the growth in nominal GDP from 1970 to 1990. Year 1970 1980 1990 2000 Nominal GDP $1,250 $1,000 $1,900 $1,850 Provide your answer below: FEEDBACK MORE INST
Based on the table below, calculate nominal GDP real GDP, the GDP deflator, and the infation...
 Based on the table below, calculate nominal GDP real GDP, the GDP deflator, and the infation rate in each year and fill in the missing parts of the table Use 2010 as the base year Instructions: Round nominal and real GDP values to two decimal places. Round GDP deflator and inflation rate values to the nearest whole number Quantity Price of Quantity Price of Real GOP ($) GOP deflator Inflation rate (%) Year of orange of beach beach ball GDP...
Fill in the missing data in the following table. Year Nominal GDP GDP deflator Real GDP...
 Fill in the missing data in the following table. Year Nominal GDP GDP deflator Real GDP $ 2012 $220000 100.0 2013 $215,000 110.0 2014 $260,000 $220,000 2015 $290,000 $ 123.0 2016 $240,000 130.0
Fill in the missing information: Year Nominal GDP Real GDP GDP Deflator 1 $8,000 billion $8,000...
 Fill in the missing information: Year Nominal GDP Real GDP GDP Deflator 1 $8,000 billion $8,000 billion 100 $ 2 $9,028.8 billion 108 billion 3 $9,806.28 $8,527.2 billion The economy's growth rate is % from year 1 to year 2 and % from year 2 to year 3.
Notice that the distinction between nominal and real (or current dollar and constant dollar units) applies...
 Notice that the distinction between nominal and real (or current dollar and constant dollar units) applies only to variables measured in dollars. An hour worked is an hour worked. There is no such thing as nominal hours worked This table measures output using dollars that have the purchasing power that a dollar had in 2005. The label "Real Output" tells you that the effects of inflation have indeed been removed from this measure. Calculate the missing values for labor productivity...
Good Laptops Bread Year 2000 2010 Quantity Price Quantity Price 100 $2,000 500 $3,000 500,000 $10...
 Good Laptops Bread Year 2000 2010 Quantity Price Quantity Price 100 $2,000 500 $3,000 500,000 $10 400,000 $20 Using the year 2000 as the base year, compute - nominal GDP [1 point] - real GDP (1 point] - GDP deflator 1 point]
2. The following data give real GDP (Y), capital (K), and labor (L), for the Wakandan...
 2. The following data give real GDP (Y), capital (K), and labor (L), for the Wakandan economy in various years. Year TFP Growth in % (please round (please round to to the nearest the nearest whole whole number) number 1960 970 1980 1990 2000 12,560 15,402137 2010 14,784 18,513 139 3,109 3,883 66 4,722 5,863 79 6,450 8,43399 8,955 11,460119 Assume that the production function for Wakanda is Y- AK03. Please fill out the empty cells in the table above....
 6. Complete the following table: Real GDP Nominal GDP 526.4 1038.5 2789.5 GDP Deflator 21.0 27.5 Year 1960 1970 1980 1990 1995 2000 2003 81.6 5165.7 7112.5 8032.2 7397.7 9817.0 11004.1 100.0 106.0 7. The nominal salary paid to the President of the United States along with the data for the CPI are given for various years below. Year 1920 1940 1960 1980 2000 Presidential Salary 75,000 75,000 100,000 200,000 400,000 CPI (2000 = 100) 11.6 8.1 17.2 47.9 100.0...
 help finish this
Apps Managed Service. Assignments: Psy.. m Course: MA 121 (0... Vitalsource: Sign In The Beginner's Gu.. Une Remaining Time: 13 minutes, 52 seconds. Question Completion Status: QUESTION ,B: 4800 GDP Deflator Using the chart below, fill in the missing parts (A: 40 10000 .D: 12500 17500 H: 125 Report your answers without any commas. Year Real GDP (base = 2020) 2000 6,000 2005 8,000 2010 2015 12,500 2020 2025 14,000 2030 20,000 Nominal GDP 2,400 В. 8,000...
help finish this
Apps Managed Service. Assignments: Psy.. m Course: MA 121 (0... Vitalsource: Sign In The Beginner's Gu.. Une Remaining Time: 13 minutes, 52 seconds. Question Completion Status: QUESTION ,B: 4800 GDP Deflator Using the chart below, fill in the missing parts (A: 40 10000 .D: 12500 17500 H: 125 Report your answers without any commas. Year Real GDP (base = 2020) 2000 6,000 2005 8,000 2010 2015 12,500 2020 2025 14,000 2030 20,000 Nominal GDP 2,400 В. 8,000...
 mework 19.2 Adjusting Nominal Values to Real Values and I Jer Time Question Using the table below, determine the growth in nominal GDP from 1970 to 1990. Year 1970 1980 1990 2000 Nominal GDP $1,250 $1,000 $1,900 $1,850 Provide your answer below: FEEDBACK MORE INST
 Based on the table below, calculate nominal GDP real GDP, the GDP deflator, and the infation rate in each year and fill in the missing parts of the table Use 2010 as the base year Instructions: Round nominal and real GDP values to two decimal places. Round GDP deflator and inflation rate values to the nearest whole number Quantity Price of Quantity Price of Real GOP ($) GOP deflator Inflation rate (%) Year of orange of beach beach ball GDP...
 Fill in the missing data in the following table. Year Nominal GDP GDP deflator Real GDP $ 2012 $220000 100.0 2013 $215,000 110.0 2014 $260,000 $220,000 2015 $290,000 $ 123.0 2016 $240,000 130.0
 Fill in the missing information: Year Nominal GDP Real GDP GDP Deflator 1 $8,000 billion $8,000 billion 100 $ 2 $9,028.8 billion 108 billion 3 $9,806.28 $8,527.2 billion The economy's growth rate is % from year 1 to year 2 and % from year 2 to year 3.
 Notice that the distinction between nominal and real (or current dollar and constant dollar units) applies only to variables measured in dollars. An hour worked is an hour worked. There is no such thing as nominal hours worked This table measures output using dollars that have the purchasing power that a dollar had in 2005. The label "Real Output" tells you that the effects of inflation have indeed been removed from this measure. Calculate the missing values for labor productivity...
 Good Laptops Bread Year 2000 2010 Quantity Price Quantity Price 100 $2,000 500 $3,000 500,000 $10 400,000 $20 Using the year 2000 as the base year, compute - nominal GDP [1 point] - real GDP (1 point] - GDP deflator 1 point]
 2. The following data give real GDP (Y), capital (K), and labor (L), for the Wakandan economy in various years. Year TFP Growth in % (please round (please round to to the nearest the nearest whole whole number) number 1960 970 1980 1990 2000 12,560 15,402137 2010 14,784 18,513 139 3,109 3,883 66 4,722 5,863 79 6,450 8,43399 8,955 11,460119 Assume that the production function for Wakanda is Y- AK03. Please fill out the empty cells in the table above....
Most questions answered within 3 hours.
-
IN PYTHON ONLY !! Program 2: Re-work
program #5 (WeeklyHours) from the previous assignment such that...
asked 30 minutes ago -
The average length of time between arrivals at a turnpike
toll-booth is 26 seconds. What is...
asked 2 hours ago -
(a) A piston at 6.1 atm contains a gas that occupies a volume of
3.5 L....
asked 3 hours ago -
Please answer true or false. Words
cannot be changed or added in to make it true...
asked 3 hours ago -
An empty test tube weighs 15.923 grams. Then,
MgCl2•6H2O is added into the test tube. After...
asked 3 hours ago -
Assume memory access is 10 units of time and disk access is
10000 units of time....
asked 3 hours ago -
1. Are all good samples random?
2. Magazines often report surveys giving statistics such as “63%...
asked 4 hours ago -
Under all the various types of market structures, firms
must eventually earn some economic profits for...
asked 3 hours ago -
Consider the following fitness regime for a single locus trait
with two co-dominant alleles: w11 =...
asked 3 hours ago -
A large cable company reports the following.
80% of its customers subscribe to its cable TV...
asked 4 hours ago -
Please answer the question in brief.
Discuss the role of ERP in organizations. Are ERP tools...
asked 3 hours ago -
Discuss the pros and cons of collaborative software such
as SameTime. Does it increase productivity? What...
asked 4 hours ago