
Homework Answers

 |
 |
 |
 |


![\small \small \Rightarrow P(Z\leq z)-\left [ 1-P(Z\leq z) \right ]=0.40\;\;\;\;\;\;\;\left [ \because P(Z\leq -z)=1-P(Z\leq z) \right ]](http://img.homeworklib.com/questions/ba863380-a37a-11ea-ab8b-b94349d5c713.png?x-oss-process=image/resize,w_560)

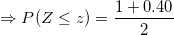

Refer Standard normal table/Z-table, Lookup for z-score corresponding to area 0.70 to the left of the normal curve or use excel formula "=NORM.S.INV(0.70)" to find the z-score.


Add Answer to:
Question 3 of 3 (2 points) 6.2 Section Exercise 20 If the average price of a...
alekscgi/x/sl.exe/10_u-IgNsikr7j8P3JH-IBxu5JdZ3xPuEkyCddiBj_BgYfWoGt3qg81rYOB10kKJv4 Elementary Statistics: A Step-By-Step Approach, 10th Ed. |MATH 6.2 Application of the Normal Distribution nect"...
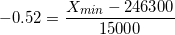
 alekscgi/x/sl.exe/10_u-IgNsikr7j8P3JH-IBxu5JdZ3xPuEkyCddiBj_BgYfWoGt3qg81rYOB10kKJv4 Elementary Statistics: A Step-By-Step Approach, 10th Ed. |MATH 6.2 Application of the Normal Distribution nect" Hosted by ALEKS Corp. Previous 1 2 4 5 6 7 8 9 10 Next Question 8 of 11 (1 point) 6.2 Section Exercise 20 If the average price of a new one-family home is $246,300 with a standard deviation of $15,000, find the minimum and maximum prices of the houses that a contractor will build to satisfy the middle 80% of the market....
. If the average price of a new home is $200,000, find the maximum and minimum...
. If the average price of a new home is $200,000, find the maximum and minimum prices of the houses that a contractor should build to include the middle 60% of the market. Assume the standard deviation of prices is $2,000 and the variable is normally distributed.
Question 2 of 4 (3 points) 7.1 Section Exercise 16 A random sample of the number...
 Question 2 of 4 (3 points) 7.1 Section Exercise 16 A random sample of the number of farms (in thousands) in various states follows. Estimate the mean number of farms per state with 95% confidence. Assumo = 31. Round intermediate and final answers to one decimal place. Assume the population is normally distributed. 95 47 50 40 109 78 6 52 21 15 7 68 16 48 79 44 Source: New York Times Almanac. Download data < u
9.2 Section Exercise 1 Question 9 of 15 (3 points) The out-of-state tuitions (in dollars) for...
 9.2 Section Exercise 1 Question 9 of 15 (3 points) The out-of-state tuitions (in dollars) for random samples of both public and private four-year colleges in a New England state are listed. Find the 95% confidence interval for the difference in the means. Assume the variables are normally distributed and the variances are unequal. Round sample statistics and final answer to two decimal places. Public 7,050 7,050 9,000 7,871 Private 16,590 23,400 13,495 17,300 19,024 14,150 12,500 6,450 15,820 9,...
Question 5 of 5 (1 point) The number of unhealthy days based on the AQI (Air...
 Question 5 of 5 (1 point) The number of unhealthy days based on the AQI (Air Quality Index) for a random sample of metropolitan areas is shown. Round the sample statistics and final answers to one decimal place. 7.2 Section Exercise 20 3 23 21 14 5 40 61 39 Source: New York Times Almanac. Download data Construct a 90% confidence interval based on the data. Assume the variable is normally distributed. Ru
Question 5 of 5 (1 point) The number of unhealthy days based on the AQI (Air...
 Question 5 of 5 (1 point) The number of unhealthy days based on the AQI (Air Quality Index) for a random sample of metropolitan areas is shown. Round the sample statistics and final answers to one decimal place. 7.2 Section Exercise 20 27 5 50 6 15 3 23 21 145 Source: New York Times Almanac. Download data Construct a 90% confidence interval based on the data. Assume the variable is normally distributed.
Question 7 of 31 (1 point) 9.2 Section Exercise 9 (table) The data show the heights...
 Question 7 of 31 (1 point) 9.2 Section Exercise 9 (table) The data show the heights in feet of waterfalls in Europe and in Asia. Find the 99% confidence for the difference of the means. Source: World Almanac. Round the answers to one decimal places. Europe Asia 830 487 900 1312 345 984 820 614 1137 350 722 722 964 Download data Use i for the mean height of waterfalls in Europe. Assume the variables are normally distributed and the...
Question 3 of 6 (1 point) View problem in a pop-up 8.2 Section Exercise 8 The...
 Question 3 of 6 (1 point) View problem in a pop-up 8.2 Section Exercise 8 The mean salary of federal government employees on the General Schedule is $59,593. The average salary of 33 state employees who do similar work is $58,930 witho = $1500. At the 0.10 level of significance, can it be concluded that state employees earn on average less than federal employees? Source: New York Times Almanac. Part 1 State the hypotheses and identify the claim with the...
The average hourly pay for a company is $20 with a standard deviation of $3. Furthermore,...
 The average hourly pay for a company is $20 with a standard deviation of $3. Furthermore, it is known that the hourly pay rates are normally distributed. (a) [2] What is the probability that a randomly selected employee will have an hourly wage of at least $26? (b) [4] What are the minimum and the maximum hourly wages of the middle 90% of employees? (c) [4] If 15 of the employees have hourly pay rates less than $17, how many...
Question 26 of 26 (2 points) View problem in a pop-up 6.3 Section Exerci In a...
 Question 26 of 26 (2 points) View problem in a pop-up 6.3 Section Exerci In a recent year, Delaware had the highest per capita annual income with $51,803. If o = $4850, answer the following questions. Assume that the sample is taken from a large population and the correction factor can be ignored. Round intermediatez -value calculations to two decimal places and the final answers to four decimal places. Source: New York Times Almanac. Part 1 out of 2 What...
 alekscgi/x/sl.exe/10_u-IgNsikr7j8P3JH-IBxu5JdZ3xPuEkyCddiBj_BgYfWoGt3qg81rYOB10kKJv4 Elementary Statistics: A Step-By-Step Approach, 10th Ed. |MATH 6.2 Application of the Normal Distribution nect" Hosted by ALEKS Corp. Previous 1 2 4 5 6 7 8 9 10 Next Question 8 of 11 (1 point) 6.2 Section Exercise 20 If the average price of a new one-family home is $246,300 with a standard deviation of $15,000, find the minimum and maximum prices of the houses that a contractor will build to satisfy the middle 80% of the market....
 Question 2 of 4 (3 points) 7.1 Section Exercise 16 A random sample of the number of farms (in thousands) in various states follows. Estimate the mean number of farms per state with 95% confidence. Assumo = 31. Round intermediate and final answers to one decimal place. Assume the population is normally distributed. 95 47 50 40 109 78 6 52 21 15 7 68 16 48 79 44 Source: New York Times Almanac. Download data < u
 9.2 Section Exercise 1 Question 9 of 15 (3 points) The out-of-state tuitions (in dollars) for random samples of both public and private four-year colleges in a New England state are listed. Find the 95% confidence interval for the difference in the means. Assume the variables are normally distributed and the variances are unequal. Round sample statistics and final answer to two decimal places. Public 7,050 7,050 9,000 7,871 Private 16,590 23,400 13,495 17,300 19,024 14,150 12,500 6,450 15,820 9,...
 Question 5 of 5 (1 point) The number of unhealthy days based on the AQI (Air Quality Index) for a random sample of metropolitan areas is shown. Round the sample statistics and final answers to one decimal place. 7.2 Section Exercise 20 3 23 21 14 5 40 61 39 Source: New York Times Almanac. Download data Construct a 90% confidence interval based on the data. Assume the variable is normally distributed. Ru
 Question 5 of 5 (1 point) The number of unhealthy days based on the AQI (Air Quality Index) for a random sample of metropolitan areas is shown. Round the sample statistics and final answers to one decimal place. 7.2 Section Exercise 20 27 5 50 6 15 3 23 21 145 Source: New York Times Almanac. Download data Construct a 90% confidence interval based on the data. Assume the variable is normally distributed.
 Question 7 of 31 (1 point) 9.2 Section Exercise 9 (table) The data show the heights in feet of waterfalls in Europe and in Asia. Find the 99% confidence for the difference of the means. Source: World Almanac. Round the answers to one decimal places. Europe Asia 830 487 900 1312 345 984 820 614 1137 350 722 722 964 Download data Use i for the mean height of waterfalls in Europe. Assume the variables are normally distributed and the...
 Question 3 of 6 (1 point) View problem in a pop-up 8.2 Section Exercise 8 The mean salary of federal government employees on the General Schedule is $59,593. The average salary of 33 state employees who do similar work is $58,930 witho = $1500. At the 0.10 level of significance, can it be concluded that state employees earn on average less than federal employees? Source: New York Times Almanac. Part 1 State the hypotheses and identify the claim with the...
 The average hourly pay for a company is $20 with a standard deviation of $3. Furthermore, it is known that the hourly pay rates are normally distributed. (a) [2] What is the probability that a randomly selected employee will have an hourly wage of at least $26? (b) [4] What are the minimum and the maximum hourly wages of the middle 90% of employees? (c) [4] If 15 of the employees have hourly pay rates less than $17, how many...
 Question 26 of 26 (2 points) View problem in a pop-up 6.3 Section Exerci In a recent year, Delaware had the highest per capita annual income with $51,803. If o = $4850, answer the following questions. Assume that the sample is taken from a large population and the correction factor can be ignored. Round intermediatez -value calculations to two decimal places and the final answers to four decimal places. Source: New York Times Almanac. Part 1 out of 2 What...
Most questions answered within 3 hours.
-
Minitab Problem: Take the Lake Hume June rainfall data and find
use the processes outlined in...
asked 34 minutes ago -
X Company is trying to decide whether to continue using old
equipment to make Product A...
asked 35 minutes ago -
IN PYTHON ONLY !! Program 2: Re-work
program #5 (WeeklyHours) from the previous assignment such that...
asked 1 hour ago -
The average length of time between arrivals at a turnpike
toll-booth is 26 seconds. What is...
asked 2 hours ago -
(a) A piston at 6.1 atm contains a gas that occupies a volume of
3.5 L....
asked 4 hours ago -
Please answer true or false. Words
cannot be changed or added in to make it true...
asked 4 hours ago -
An empty test tube weighs 15.923 grams. Then,
MgCl2•6H2O is added into the test tube. After...
asked 4 hours ago -
Assume memory access is 10 units of time and disk access is
10000 units of time....
asked 4 hours ago -
1. Are all good samples random?
2. Magazines often report surveys giving statistics such as “63%...
asked 4 hours ago -
Under all the various types of market structures, firms
must eventually earn some economic profits for...
asked 4 hours ago -
Consider the following fitness regime for a single locus trait
with two co-dominant alleles: w11 =...
asked 4 hours ago -
A large cable company reports the following.
80% of its customers subscribe to its cable TV...
asked 4 hours ago