1. WHAT IS THE LORENZ CURVE? IN A COUNTRY WITH A GINI INDEX OF 0 WHAT...
1. WHAT IS THE LORENZ CURVE? IN A COUNTRY WITH A GINI INDEX OF 0 WHAT WOULD THE CURVE LOOK LIKE?
2. DESCRIBE A SOCIAL SAFETY NET FOR THE ELDERLY IN THE UNITED STATES.
3. WHAT ARE THE TWO OBJECTIVES FOR THE ECONOMY?
Homework Answers
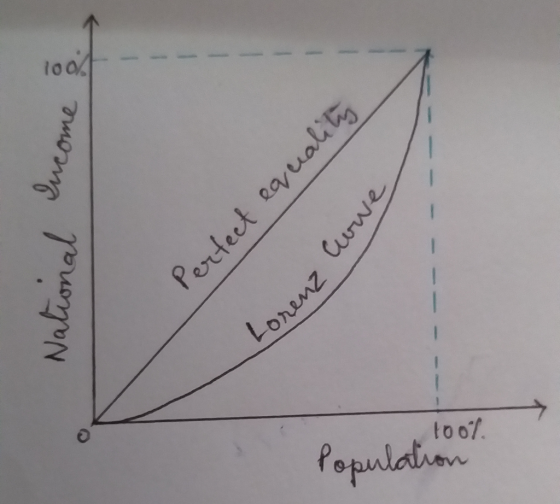
Lorenz curve
1.The Lorenz curve is a curve or graphical representation developed by Max Lorenz. It shows the inequality in spread of income and wealth. It shows the proportion of income earned by any given percentage of the population.
A Gini coefficient varies from 0 to 1. Zero means there is perfect equality and 1 means there is perfect inequality.
2.Social safety net for the elderly in the US.
A war was declared in US in the year 1964 and at that time the poverty level was 19%. The social safety net was set up with various welfare programs for the betterment of the Americans. It helped the low income group people to uplift themselves from poverty and hardships. From the name itself we can understand that it acts like a safety net which catches the poor Americans if the fall in their poverty. The target of this program is to bring back the poor Americans to their body safe and sound , to give them a better standard of living, to give them some benefits for free like food, housing, counseling etc.
The two objectives for the US economy are:
- To reduce extreme poverty
- To have inclusive economic growth to reduce political turmoil and conflicts between countries.
Add Answer to:
1. WHAT IS THE LORENZ CURVE? IN A COUNTRY WITH A GINI INDEX OF 0
WHAT...
x-2 Find the Gini index of income concentration for the Lorenz curve with equation y =xe The Gini index isRoud to the nearest thousandth as needed.) x-2 Find the Gini index of income concentrati...
 x-2 Find the Gini index of income concentration for the Lorenz curve with equation y =xe The Gini index isRoud to the nearest thousandth as needed.)
x-2 Find the Gini index of income concentration for the Lorenz curve with equation y =xe The Gini index isRoud to the nearest thousandth as needed.)
x-2 Find the Gini index of income concentration for the Lorenz curve with equation y =xe The Gini index isRoud to the nearest thousandth as needed.)
3. The Gini Index Problem How is possible to measure the distribution of income among the inhabit...
 3. The Gini Index Problem How is possible to measure the distribution of income among the inhabitants of a given country One such measure is the Gini index, named after the Italian economist Corrado Gini, who first devised it in 1912. We first rank all households in a country by income and then we compute the percentage of households whose income is at most a given percentage of the country's total income. We define a Lorenz Curve y L(x) on...
3. In a certain country the Lorenz Curve is modeled by L(x)- .95x2- 26x +31 a. Determine what per...
 3. In a certain country the Lorenz Curve is modeled by L(x)- .95x2- 26x +31 a. Determine what percent of the wealth the poorest 60% controls. .496 or 49.6% b. Determine what percent of the wealth the wealthiest 25% control. 1-.25=.75 .649375 or 64.9% c. Find the Gini index
3. In a certain country the Lorenz Curve is modeled by L(x)- .95x2- 26x +31 a. Determine what percent of the wealth the poorest 60% controls. .496 or 49.6% b. Determine...
3. In a certain country the Lorenz Curve is modeled by L(x)- .95x2- 26x +31 a. Determine what percent of the wealth the poorest 60% controls. .496 or 49.6% b. Determine what percent of the wealth the wealthiest 25% control. 1-.25=.75 .649375 or 64.9% c. Find the Gini index
3. In a certain country the Lorenz Curve is modeled by L(x)- .95x2- 26x +31 a. Determine what percent of the wealth the poorest 60% controls. .496 or 49.6% b. Determine...
I need help with this question please! - 4 marks) In economics, a population's Lorenz curve...
 I need help with this question
please!
- 4 marks) In economics, a population's Lorenz curve L(2) gives the percentage (as a decimal) of the country's distribution of wealth among the lowest earning percentage 2 (as a decimal between 0 and 1; e.g., 35% means x = 0.35) of the population. As an example, if L(0.4) = 0.1, then this means that the lowest earning 40% of households have only 10% of the entire economy's wealth. The line y =...
I need help with this question
please!
- 4 marks) In economics, a population's Lorenz curve L(2) gives the percentage (as a decimal) of the country's distribution of wealth among the lowest earning percentage 2 (as a decimal between 0 and 1; e.g., 35% means x = 0.35) of the population. As an example, if L(0.4) = 0.1, then this means that the lowest earning 40% of households have only 10% of the entire economy's wealth. The line y =...
1) Figure 2 below is an image of a Lorenz curve. a. (4) When the Lorenz...
 1) Figure 2 below is an image of a Lorenz curve. a. (4) When the Lorenz curve sags lower, does that mean the economy is more equal or more unequal? I i. What does a high number indicate? b. (Explain how to use the information in Figure 2 to calculate the Gini coefficient. i. What is the typical range for Gini coefficients? ii. What does a high number indicate? 100 Perfect Equality Line Percentage of Income Lorenz Curve 0 100...
1) Figure 2 below is an image of a Lorenz curve. a. (4) When the Lorenz...
 1) Figure 2 below is an image of a Lorenz curve. a. (4) When the Lorenz curve sags lower, does that mean the economy is more equal or more unequal? b. (6) Explain how to use the information in Figure 2 to calculate the Gini coefficient 1. What is the typical range for Gini coefficients? ii. What does a high number indicate? 100 Perfect Equality Line Percentage of income Lorenz Curve 100 Percentage of Population Figure 2 2) (10) Describe...
1) Figure 2 below is an image of a Lorenz curve. a. (4) When the Lorenz...
 1) Figure 2 below is an image of a Lorenz curve. a. (4) When the Lorenz curve sags lower, does that mean the economy is more equal or more unequal? b. (6) Explain how to use the information in Figure 2 to calculate the Gini coefficient. i. What is the typical range for Gini coefficients? ii. What does a high number indicate? 100 Perfect Equality Line Percentage of Income Lorenz Curve 100 Percentage of Population Figure 2 2) (10) Describe...
• Consider the following Lorenz curves for two countries. Country 1: cis = cip4 Country 2:...
 • Consider the following Lorenz curves for two countries. Country 1: cis = cip4 Country 2: cis = cip cis: cumulative income share (1 = 100%) cps: cumulative population share (1 = 100%) • Which of the following statements is correct? a) Country l’s Gini index is 3/5. b) Country 2’s Gini index is 5/7. c) Both a and b. d) None of the above.
1) Figure 2 below is an image of a Lorenz curve.
 1) Figure 2 below is an image of a Lorenz curve. a. When the Lorenz curve sags lower, does that mean the economy is more equal or more unequal? b. Explain how to use the information in Figure 2 to calculate the Gini coefficient. i. What is the typical range for Gini coefficients? ii. What does a high number indicate? 2) (10) Describe the inequality in income and wealth between countries, and explain whether each has grown or shrank over the past 50 years. Why...
Problem 4 Economic Inequality (20 points) 1) Figure 2 below is an image of a Lorenz...
 Problem 4 Economic Inequality (20 points) 1) Figure 2 below is an image of a Lorenz curve. a. (4) When the Lorenz curve sags lower, does that mean the economy is more equal or more unequal? b. (6) Explain how to use the information in Figure 2 to calculate the Gini coefficient i. What is the typical range for Gini coefficients? ii. What does a high number indicate? 100 Perfect Equality Line Percentage of income Lorenz Curve 100 Percentage of...
 x-2 Find the Gini index of income concentration for the Lorenz curve with equation y =xe The Gini index isRoud to the nearest thousandth as needed.)
x-2 Find the Gini index of income concentration for the Lorenz curve with equation y =xe The Gini index isRoud to the nearest thousandth as needed.)
x-2 Find the Gini index of income concentration for the Lorenz curve with equation y =xe The Gini index isRoud to the nearest thousandth as needed.)
 3. The Gini Index Problem How is possible to measure the distribution of income among the inhabitants of a given country One such measure is the Gini index, named after the Italian economist Corrado Gini, who first devised it in 1912. We first rank all households in a country by income and then we compute the percentage of households whose income is at most a given percentage of the country's total income. We define a Lorenz Curve y L(x) on...
 3. In a certain country the Lorenz Curve is modeled by L(x)- .95x2- 26x +31 a. Determine what percent of the wealth the poorest 60% controls. .496 or 49.6% b. Determine what percent of the wealth the wealthiest 25% control. 1-.25=.75 .649375 or 64.9% c. Find the Gini index
3. In a certain country the Lorenz Curve is modeled by L(x)- .95x2- 26x +31 a. Determine what percent of the wealth the poorest 60% controls. .496 or 49.6% b. Determine...
3. In a certain country the Lorenz Curve is modeled by L(x)- .95x2- 26x +31 a. Determine what percent of the wealth the poorest 60% controls. .496 or 49.6% b. Determine what percent of the wealth the wealthiest 25% control. 1-.25=.75 .649375 or 64.9% c. Find the Gini index
3. In a certain country the Lorenz Curve is modeled by L(x)- .95x2- 26x +31 a. Determine what percent of the wealth the poorest 60% controls. .496 or 49.6% b. Determine...
 I need help with this question
please!
- 4 marks) In economics, a population's Lorenz curve L(2) gives the percentage (as a decimal) of the country's distribution of wealth among the lowest earning percentage 2 (as a decimal between 0 and 1; e.g., 35% means x = 0.35) of the population. As an example, if L(0.4) = 0.1, then this means that the lowest earning 40% of households have only 10% of the entire economy's wealth. The line y =...
I need help with this question
please!
- 4 marks) In economics, a population's Lorenz curve L(2) gives the percentage (as a decimal) of the country's distribution of wealth among the lowest earning percentage 2 (as a decimal between 0 and 1; e.g., 35% means x = 0.35) of the population. As an example, if L(0.4) = 0.1, then this means that the lowest earning 40% of households have only 10% of the entire economy's wealth. The line y =...
 1) Figure 2 below is an image of a Lorenz curve. a. (4) When the Lorenz curve sags lower, does that mean the economy is more equal or more unequal? I i. What does a high number indicate? b. (Explain how to use the information in Figure 2 to calculate the Gini coefficient. i. What is the typical range for Gini coefficients? ii. What does a high number indicate? 100 Perfect Equality Line Percentage of Income Lorenz Curve 0 100...
 1) Figure 2 below is an image of a Lorenz curve. a. (4) When the Lorenz curve sags lower, does that mean the economy is more equal or more unequal? b. (6) Explain how to use the information in Figure 2 to calculate the Gini coefficient 1. What is the typical range for Gini coefficients? ii. What does a high number indicate? 100 Perfect Equality Line Percentage of income Lorenz Curve 100 Percentage of Population Figure 2 2) (10) Describe...
 1) Figure 2 below is an image of a Lorenz curve. a. (4) When the Lorenz curve sags lower, does that mean the economy is more equal or more unequal? b. (6) Explain how to use the information in Figure 2 to calculate the Gini coefficient. i. What is the typical range for Gini coefficients? ii. What does a high number indicate? 100 Perfect Equality Line Percentage of Income Lorenz Curve 100 Percentage of Population Figure 2 2) (10) Describe...
 • Consider the following Lorenz curves for two countries. Country 1: cis = cip4 Country 2: cis = cip cis: cumulative income share (1 = 100%) cps: cumulative population share (1 = 100%) • Which of the following statements is correct? a) Country l’s Gini index is 3/5. b) Country 2’s Gini index is 5/7. c) Both a and b. d) None of the above.
 Problem 4 Economic Inequality (20 points) 1) Figure 2 below is an image of a Lorenz curve. a. (4) When the Lorenz curve sags lower, does that mean the economy is more equal or more unequal? b. (6) Explain how to use the information in Figure 2 to calculate the Gini coefficient i. What is the typical range for Gini coefficients? ii. What does a high number indicate? 100 Perfect Equality Line Percentage of income Lorenz Curve 100 Percentage of...
Most questions answered within 3 hours.
-
Please answer true or false. Words
cannot be changed or added in to make it true...
asked 51 minutes ago -
An empty test tube weighs 15.923 grams. Then,
MgCl2•6H2O is added into the test tube. After...
asked 53 minutes ago -
(a) A piston at 6.1 atm contains a gas that occupies a volume of
3.5 L....
asked 52 minutes ago -
Assume memory access is 10 units of time and disk access is
10000 units of time....
asked 1 hour ago -
1. Are all good samples random?
2. Magazines often report surveys giving statistics such as “63%...
asked 1 hour ago -
Under all the various types of market structures, firms
must eventually earn some economic profits for...
asked 1 hour ago -
Consider the following fitness regime for a single locus trait
with two co-dominant alleles: w11 =...
asked 1 hour ago -
A large cable company reports the following.
80% of its customers subscribe to its cable TV...
asked 1 hour ago -
Please answer the question in brief.
Discuss the role of ERP in organizations. Are ERP tools...
asked 1 hour ago -
Discuss the pros and cons of collaborative software such
as SameTime. Does it increase productivity? What...
asked 1 hour ago -
Buying your in-laws a gift because it’s expected is
due to the ____________ motive of gift-giving....
asked 1 hour ago -
Calculate the expected value, the variance, and the standard
deviation of the given random variable X....
asked 2 hours ago