Understanding Variation/Managing Chaos
Compute Average Moving Range, Natural Process Limits,Upper Range Limit
Please answer ONLY questions 5, 6 and 7. Page 60 and 137 formulas provided here in image 4 and 5. Thanks


Homework Answers
Xbar=sum of observation/Total no of observation
X bar= 10.5+11.2+9.2+10.1+10.4+10.5/6
Xbar=10.31
Average moving range
mR=| Xj-Xj-1|
mR bar = 1/m-1 * sum( mR )
=1/5*4
mR bar=0.8
| Jul | Aug | Sep | Oct | Nov | Dec | |
| X | 10.5 | 11.2 | 9.2 | 10.1 | 10.4 | 10.5 |
| mR | 0.7 | 2.0 | 0.9 | 0.3 | 0.1 |
5) upper natural process limit
UNPL=Xbar+(2.66*mRbar)
UNPL=10.31+(2.66*0.8)
UNPL=12.43
6) Lower natural process limit
LNPL=Xbar-(2.66*mRbar)
LNPL=10.31-(2.66*0.8)
LNPL=8.18
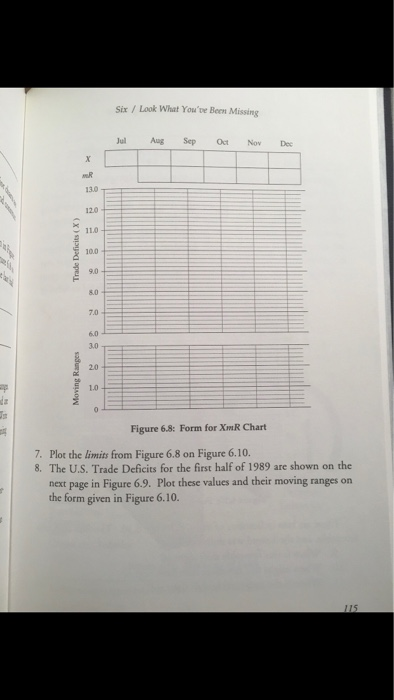
7) plot of limits

Add Answer to:
Understanding Variation/Managing Chaos
Compute Average Moving Range, Natural Process Limits,Upper Range
Limit
Please answer ONLY questions...
Understanding Variation, Question 1-10, (pg 114-116) Last page (60) shows formula. Must be answered in excel. Understan...
 Understanding Variation, Question 1-10, (pg 114-116) Last page
(60) shows formula. Must be answered in excel.
Understanding Variation /Managing Chaos WHAT SHOULD YOu DO NOW? Statistics has never been a spectator sport. Process behavior charts are no exception. You should see if you can compute the limits and construct an XmR chart 1. The U.S. Trade Deficits for the last half of 1988 are shown in Figure 6.7. Use the data of Figure 6.7, and the blank form in Figure...
Understanding Variation, Question 1-10, (pg 114-116) Last page
(60) shows formula. Must be answered in excel.
Understanding Variation /Managing Chaos WHAT SHOULD YOu DO NOW? Statistics has never been a spectator sport. Process behavior charts are no exception. You should see if you can compute the limits and construct an XmR chart 1. The U.S. Trade Deficits for the last half of 1988 are shown in Figure 6.7. Use the data of Figure 6.7, and the blank form in Figure...
Question 4 [20 marks] By utilising Annexure A, answer the following questions: (a) 15 samples of...
 Question 4 [20 marks] By utilising Annexure A, answer the following questions: (a) 15 samples of n 8 have been taken from a cleaning operation. The average sample range for the 20 samples was 0.016 minute, and the average mean was 3 minutes. Determine the three-sigma control limits for this process. (4 marks) (b) 15 samples of n 10 observations have been taken from a milling process. The average sample range is 0.01 centimetres. Determine upper and lower control limits...
 Understanding Variation, Question 1-10, (pg 114-116) Last page
(60) shows formula. Must be answered in excel.
Understanding Variation /Managing Chaos WHAT SHOULD YOu DO NOW? Statistics has never been a spectator sport. Process behavior charts are no exception. You should see if you can compute the limits and construct an XmR chart 1. The U.S. Trade Deficits for the last half of 1988 are shown in Figure 6.7. Use the data of Figure 6.7, and the blank form in Figure...
Understanding Variation, Question 1-10, (pg 114-116) Last page
(60) shows formula. Must be answered in excel.
Understanding Variation /Managing Chaos WHAT SHOULD YOu DO NOW? Statistics has never been a spectator sport. Process behavior charts are no exception. You should see if you can compute the limits and construct an XmR chart 1. The U.S. Trade Deficits for the last half of 1988 are shown in Figure 6.7. Use the data of Figure 6.7, and the blank form in Figure...
 Question 4 [20 marks] By utilising Annexure A, answer the following questions: (a) 15 samples of n 8 have been taken from a cleaning operation. The average sample range for the 20 samples was 0.016 minute, and the average mean was 3 minutes. Determine the three-sigma control limits for this process. (4 marks) (b) 15 samples of n 10 observations have been taken from a milling process. The average sample range is 0.01 centimetres. Determine upper and lower control limits...
Most questions answered within 3 hours.
-
Matching: What are 4 fundamental activities in software
processes?
definition of the software function and operational...
asked 1 minute ago -
University Printers has two service departments (Maintenance and
Personnel) and two operating departments (Printing and Developing)....
asked 16 minutes ago -
This journal deals with globalization and its economic effects.
US firms have almost no restrictions on...
asked 15 minutes ago -
A local greenhouse sells coffee-tree saplings. They price their
saplings based on the height of the...
asked 29 minutes ago -
Sleep: Assume the general population gets an
average of 7 hours of sleep per night. You...
asked 32 minutes ago -
Florence, who weighs 540 N, stands on a bathroom scale in an
elevator. What will she...
asked 24 minutes ago -
Estimate the amount of Canadians who are vegans accurate to
within 2% with a 91% confidence...
asked 29 minutes ago -
As two cars move toward each other, the speedometer of one car
reads 57.9 km/h while...
asked 31 minutes ago -
A factory worker pushes a 30.0 kg crate a distance of 5.7 m
along a level...
asked 34 minutes ago -
In one statistics class, students were given one homework
assignment. The professor asked students to find...
asked 54 minutes ago -
(a) Calculate the force needed to bring a 1050 kg car to rest
from a speed...
asked 53 minutes ago -
A box contains 14 large marbles and 19 small marbles. Each
marble is either green or...
asked 1 hour ago