

Homework Answers

Add Answer to:
2. Suppose that the normally distributed random variable X has mean and standard deviation a. Calculate...
A random variable X is normally distributed with a mean of 2 and a standard deviation...
A random variable X is normally distributed with a mean of 2 and a standard deviation of 1.4. Calculate the point c such that P ( X ≥ c ) = 0.5.
A variable x is normally distributed with mean 22 and standard deviation 9. Round your answers...
A variable x is normally distributed with mean 22 and standard deviation 9. Round your answers to the nearest hundredth as needed. a) Determine the z -score for x = 26 . z = b) Determine the z -score for x = 17 . z = c) What value of x has a z -score of 0.67 ? x = d) What value of x has a z -score of − 0.4 ? x = e) What value of x...
6.33 Let x be a continuous random variable that is normally distributed with a mean of 25 and a standard deviation o...
 6.33 Let x be a continuous random variable that is normally distributed with a mean of 25 and a standard deviation of 6. Find the probability that x assumes a value a. between 28 and 34 b. between 20 and 35 6.34 Let x be a continuous random variable that has a normal distribution with a mean of 30 and a stan- dard deviation of 2. Find the probability that x assumes a value a. between 29 and 35 b....
Suppose X is a normally distributed random variable with mean 67 and standard deviation 13. Then...
Suppose X is a normally distributed random variable with mean 67 and standard deviation 13. Then P ( 47 ≤ X ≤ 84 ) is roughly
Suppose a random variable has mean 10 and standard deviation 3. What is the value of...
 Suppose a random variable has mean 10 and standard deviation 3. What is the value of the random variable which corresponds to a z-score of 2? SUBMIT ANSWER
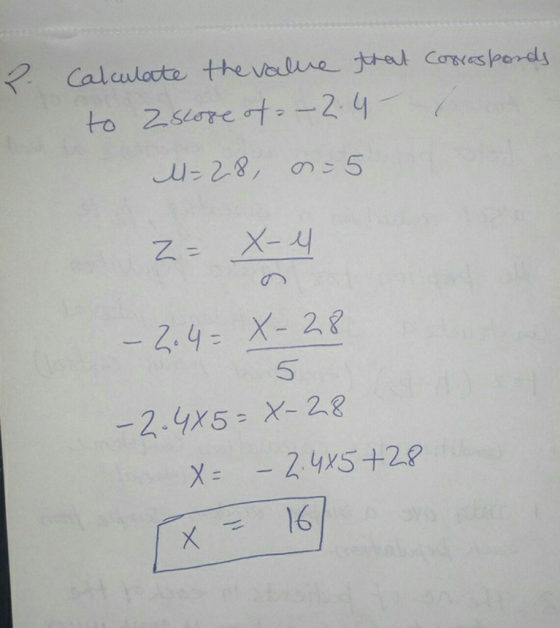
A variable xx is normally distributed with mean 22 and standard deviation 5. Round your answers...
A variable xx is normally distributed with mean 22 and standard deviation 5. Round your answers to the nearest hundredth as needed. a) Determine the z-score for x=28. b) Determine the z-score for x=18. c) What value of x has a z-score of 1.4? d) What value of x has a z-score of -0.4?
assume that the random variable x is normally distributed with mean 51 and standard deviation 11...
 assume that the random variable x is normally distributed with
mean 51 and standard deviation 11
ut the random variable is may buted with mean 51 and standard deviation 11. Compute the probability. Be sure to draw a normal curve with the coming Which of the shaded regions corresponds to POX 4112 DB ос ST PX41-
assume that the random variable x is normally distributed with
mean 51 and standard deviation 11
ut the random variable is may buted with mean 51 and standard deviation 11. Compute the probability. Be sure to draw a normal curve with the coming Which of the shaded regions corresponds to POX 4112 DB ос ST PX41-
Suppose a random variable is normally distributed with a mean of 400 and a standard deviation...
Suppose a random variable is normally distributed with a mean of 400 and a standard deviation of 100. a)Draw a normal curve with the parameters labeled. b)Shade the region under the normal curve that represents the probability of observing a value of the random variable that is less than 600. c)Suppose the area under the normal curve below 600 is 0.9772. Provide two interpretations of this area.
Suppose a random variable X is normally distributed with mean 69.8 and standard deviation 8. Answer...
Suppose a random variable X is normally distributed with mean 69.8 and standard deviation 8. Answer the following questions: P(X = 74.60) = ? [round to 4 decimal places]
A Normal random variable X has mean 20 and standard deviation 4. Calculate the probability that...
A Normal random variable X has mean 20 and standard deviation 4. Calculate the probability that specific values of X exceed 26. Calculate the 36th percentile of a Standard Normal random variable. A Standard Normal random variable Z falls within an interval of values centered around zero, that is the interval -z to z, with probability 0.6. Calculate the value of z that defines that interval. A truck makes daily round trips between Charlotte and Atlanta. On 30 percent of...
 6.33 Let x be a continuous random variable that is normally distributed with a mean of 25 and a standard deviation of 6. Find the probability that x assumes a value a. between 28 and 34 b. between 20 and 35 6.34 Let x be a continuous random variable that has a normal distribution with a mean of 30 and a stan- dard deviation of 2. Find the probability that x assumes a value a. between 29 and 35 b....
 Suppose a random variable has mean 10 and standard deviation 3. What is the value of the random variable which corresponds to a z-score of 2? SUBMIT ANSWER
 assume that the random variable x is normally distributed with
mean 51 and standard deviation 11
ut the random variable is may buted with mean 51 and standard deviation 11. Compute the probability. Be sure to draw a normal curve with the coming Which of the shaded regions corresponds to POX 4112 DB ос ST PX41-
assume that the random variable x is normally distributed with
mean 51 and standard deviation 11
ut the random variable is may buted with mean 51 and standard deviation 11. Compute the probability. Be sure to draw a normal curve with the coming Which of the shaded regions corresponds to POX 4112 DB ос ST PX41-
Most questions answered within 3 hours.
-
Which statement is not true about welfare in Canada?
A.Benefits typically vary based on one's ability...
asked 2 minutes ago -
Please help me with FLOWCHART and UML diagram for class,
thank you!
#include <iostream>
#include <fstream>...
asked 48 minutes ago -
3. Describe the “logic circuit” of the Lac operon. Which
proteins are bound or not to...
asked 49 minutes ago -
Ayesha’s adjusted gross income is $60,000 in 2019. She donated a
piece of artwork with a...
asked 55 minutes ago -
For Dijkstra’s shortest path algorithm:
a. Give the Big-O time for Dijkstra’s shortest path algorithm
and...
asked 1 hour ago -
Phosphorus violates the 'octet rule' in biological molecules,
forming more covalent bonds than expected based on...
asked 1 hour ago -
A 1.3 eV electron has a 10-4 probability of tunneling
through a 2.4 eV potential barrier....
asked 1 hour ago -
What is the one ingredient that is common to being successful
with all stakeholders?
profit
trust...
asked 1 hour ago -
Write an assembly language 32 bit program that reads in lines of
text by a .txt...
asked 1 hour ago -
what is the density ( in g/L) of hydrogen gas at 29 degrees C and a...
asked 1 hour ago -
5-6. You are considering three investment alternatives for some
spare cash: Old Reliable Corporation stock (A1),...
asked 1 hour ago -
Problem 16-02
Receivables Investment
Medwig Corporation has a DSO of 45 days. The company averages
$7,250...
asked 1 hour ago