A study was conducted that measured the total brain volume (TBV) (in ) of patients that...
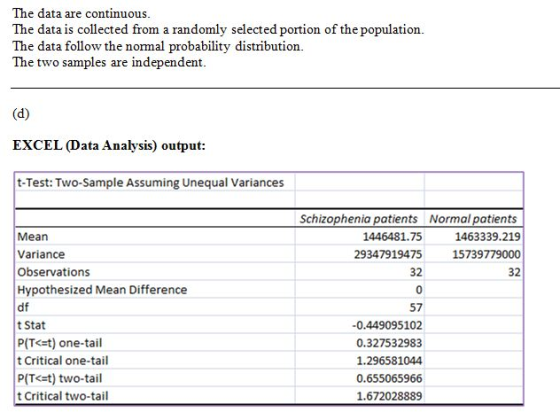
A study was conducted that measured the total brain volume (TBV) (in ) of patients that had schizophrenia and patients that are considered normal. Table #9.3.5 contains the TBV of the normal patients and table #9.3.6 contains the TBV of schizophrenia patients ("SOCR data oct2009," 2013). Is there enough evidence to show that the patients with schizophrenia have less TBV on average than a patient that is considered normal? Test at the 10% level.
Table #9.3.5: Total Brain Volume (in ) of Normal Patients
|
1663407 |
1583940 |
1299470 |
1535137 |
1431890 |
1578698 |
|
1453510 |
1650348 |
1288971 |
1366346 |
1326402 |
1503005 |
|
1474790 |
1317156 |
1441045 |
1463498 |
1650207 |
1523045 |
|
1441636 |
1432033 |
1420416 |
1480171 |
1360810 |
1410213 |
|
1574808 |
1502702 |
1203344 |
1319737 |
1688990 |
1292641 |
|
1512571 |
1635918 |
Table #9.3.6: Total Brain Volume (in ) of Schizophrenia Patients
|
1331777 |
1487886 |
1066075 |
1297327 |
1499983 |
1861991 |
|
1368378 |
1476891 |
1443775 |
1337827 |
1658258 |
1588132 |
|
1690182 |
1569413 |
1177002 |
1387893 |
1483763 |
1688950 |
|
1563593 |
1317885 |
1420249 |
1363859 |
1238979 |
1286638 |
|
1325525 |
1588573 |
1476254 |
1648209 |
1354054 |
1354649 |
|
1636119 |
- ) State the random variable and the parameter in words.
b.) If needed, state the null and alternative hypotheses and the level of significance and don't "bump" them into one line (refer to the textbook)
Ho :
HA :
a =
c.) State and check the assumptions for a hypothesis test
d.) Find the sample statistic, test statistic, and p-value, confidence interval ( whatever the task is)
e.) Conclusion
Since the p-value……..fail to reject or reject H o or confidence intervals...
f.) Interpretation ( statistical and real world)
Homework Answers


Add Answer to:
A study was conducted that measured the total brain volume (TBV)
(in ) of patients that...
A study was conducted that measured the total brain volume (TBV) (in mm3 ) of patients...
A study was conducted that measured the total brain volume (TBV) (in mm3 ) of patients that had schizophrenia and patients that are considered normal. Table #9.3.5 contains the TBV of the normal patients and table #9.3.6 contains the TBV of schizophrenia patients ("SOCR data oct2009," 2013). Compute a 90% confidence interval for the difference in TBV of normal patients and patients with Schizophrenia. Table #9.3.5: Total Brain Volume (in mm3) of Normal Patients 1663407 1583940 1299470 1535137 1431890 1578698...
A study was conducted that measured the total brain volume (TBV) (in mm3) of patients that...
A study was conducted that measured the total brain volume (TBV) (in mm3) of patients that had schizophrenia and patients that are considered normal. Table #1 contains the TBV of the normal patients and Table #2 contains the TBV of schizophrenia patients ("SOCR data Oct2009," 2013). Table #1: Total Brain Volume (in mm3) of Normal Patients 1663407 1583940 1299470 1535137 1431890 1578698 1453510 1650348 1288971 1366346 1326402 1503005 1474790 1317156 1441045 1463498 1650207 1523045 1441636 1432033 1420416 1480171 1360810 1410213...
A study by Bradbury and Miller (1985) recorded the birthdate and schizophrenia diagnosis (schizophrenia vs no...
A study by Bradbury and Miller (1985) recorded the birthdate and schizophrenia diagnosis (schizophrenia vs no schizophrenia). Birthdates were categorized into seasons (summer, fall, winter, and spring). The table below contains the frequencies of 150 birthdates and diagnoses and row and column totals. Use a chi-square test for independence. Summer Fall Winter Spring Total No Schizophrenia 26 24 22 28 100 Schizophrenia 9 11 18 12 50 Total 35 35 40 40 N = 150 a) State the null and...
6. A study used CT-scans to collect data on brain volumes for a group of patients...
 6. A study used CT-scans to collect data on brain volumes for a group of patients with obsessive- compulsive disorders and a control group of healthy persons. The results are below. Assume that the population standard deviations are not the same. Use a 0.05 significance level to test the claim that the mean brain volume for obsessive-compulsive patients is more than the mean brain volume of healthy persons. (15 pts) Obsessive-compulsive patients: n = 35 X = 1390 S =...
A study of the nutrition of dialysis patients measured the level of phosphorus in the blood...
A study of the nutrition of dialysis patients measured the level of phosphorus in the blood of a patient on 30 occasions. The mean phosphorus level for this patient was 5.2 mg/dL and a population standard deviation for all dialysis patients of 1.0 mg/dL. Is there evidence that this patient’s true mean phosphorus level significantly exceeds 4.8 mg/dL, the upper end of the “normal” range? 5. For the story above, (a) state the hypotheses, (b) calculate the test statistic and...
A hospital director is told that 68% of the treated patients are insured. The director wants...
A hospital director is told that 68% of the treated patients are insured. The director wants to test the claim that the percentage of insured patients is above the expected percentage. A sample of 180 patients found that 135 were insured. At the 0.05 level, is there enough evidence to support the director's claim? State the null and alternative hypotheses. Find the value of the test statistic. Round your answer to two decimal places Specify if the test is one-tailed...
A hospital director is told that 42% of the treated patients are uninsured. The director wants...
A hospital director is told that 42% of the treated patients are uninsured. The director wants to test the claim that the percentage of uninsured patients is over the expected percentage. A sample of 200 patients found that 100 were uninsured. At the 0.10 level, is there enough evidence to support the director's claim? (Please answer the following questions below) a. State the null and alternative hypotheses. : __________________________________ : __________________________________ b. Find the value of the test statistic. Round...
Big Rock Insurance Company did a study of per capita income and volume of insurance sales...
 Big Rock Insurance Company did a study of per capita income and volume of insurance sales in eight Midwest cities. The volume of sales in each city was ranked, with 1 being the largest volume. The per capita income was rounded to the nearest thousand dollars. Reading 1 2 3 4 5 6 7 8 Rank of insurance sales volume 2 4 3 6 7 5 8 1 Per capita Income In $1000 19 17 18 14 12 13 15...
In a program designed to help patients stop smoking, 236 patients were given sustained care, and...
 In a program designed to help patients stop smoking, 236 patients were given sustained care, and 84.3% of them were no longer smoking after one month. Use a 0.05 significance level to test the claim that 80% of patients stop smoking when given sustained care. Identify the null and alternative hypotheses for this test. Choose the correct answer below. O A. Ho:p*0.8 H: p=0.8 OB. Ho: P = 0.8 H:p<0.8 @ C. Ho: p = 0.8 H:p*0.8 OD. Ho: p=0.8...
A hospital director is told that 42% of the treated patients are uninsured. The director wants...
A hospital director is told that 42% of the treated patients are uninsured. The director wants to test the claim that the percentage of uninsured patients is above the expected percentage. A sample of 190 patients found that 95 were uninsured. At the 0.01 level, is there enough evidence to support the director's claim? a. State the null and alternative hypotheses. b. Find the value of the test statistic. Round your answer to two decimal places. c. Is this test...
 6. A study used CT-scans to collect data on brain volumes for a group of patients with obsessive- compulsive disorders and a control group of healthy persons. The results are below. Assume that the population standard deviations are not the same. Use a 0.05 significance level to test the claim that the mean brain volume for obsessive-compulsive patients is more than the mean brain volume of healthy persons. (15 pts) Obsessive-compulsive patients: n = 35 X = 1390 S =...
 Big Rock Insurance Company did a study of per capita income and volume of insurance sales in eight Midwest cities. The volume of sales in each city was ranked, with 1 being the largest volume. The per capita income was rounded to the nearest thousand dollars. Reading 1 2 3 4 5 6 7 8 Rank of insurance sales volume 2 4 3 6 7 5 8 1 Per capita Income In $1000 19 17 18 14 12 13 15...
 In a program designed to help patients stop smoking, 236 patients were given sustained care, and 84.3% of them were no longer smoking after one month. Use a 0.05 significance level to test the claim that 80% of patients stop smoking when given sustained care. Identify the null and alternative hypotheses for this test. Choose the correct answer below. O A. Ho:p*0.8 H: p=0.8 OB. Ho: P = 0.8 H:p<0.8 @ C. Ho: p = 0.8 H:p*0.8 OD. Ho: p=0.8...
Most questions answered within 3 hours.
-
A laser with a wavelength of 470. nm illuminates two narrow
slits. The interference pattern from...
asked 31 seconds from now -
1. What is the concentration of potassium hydroxide in the
reaction mixture formed by mixing 50.00...
asked 13 minutes ago -
CISC 1115 Assignment 6 Write a complete program, including
javadoc comments, to process voter statistics Input...
asked 7 minutes ago -
(25) A boat is traveling at 5.00 m/s in the same direction as
ocean waves of...
asked 10 minutes ago -
which of these answers is most reasonable estimate of the proton
concentration [h+] for an aqueous...
asked 15 minutes ago -
If the Henry’s law constant for oxygen in water is 1.3 x 10⁻³
M/atm at 25...
asked 16 minutes ago -
Light of wavelength 500 nm is used in a two slit interference
experiment, and a fringe...
asked 16 minutes ago -
Your child is planning attend summer camp for three months,
starting 7 months from now. The...
asked 26 minutes ago -
asssume you are the employee representative on the executive
board at your company. You know the...
asked 30 minutes ago -
If you have all the letters of the alphabet spread on a table.
How many different...
asked 33 minutes ago -
Tree Seedlings has the following current-year purchases and
sales for its only product. Date Activities Units...
asked 30 minutes ago -
Monopoly pricing 4. Firm X has a complete monopoly over the
production of nutmeg. The following...
asked 31 minutes ago